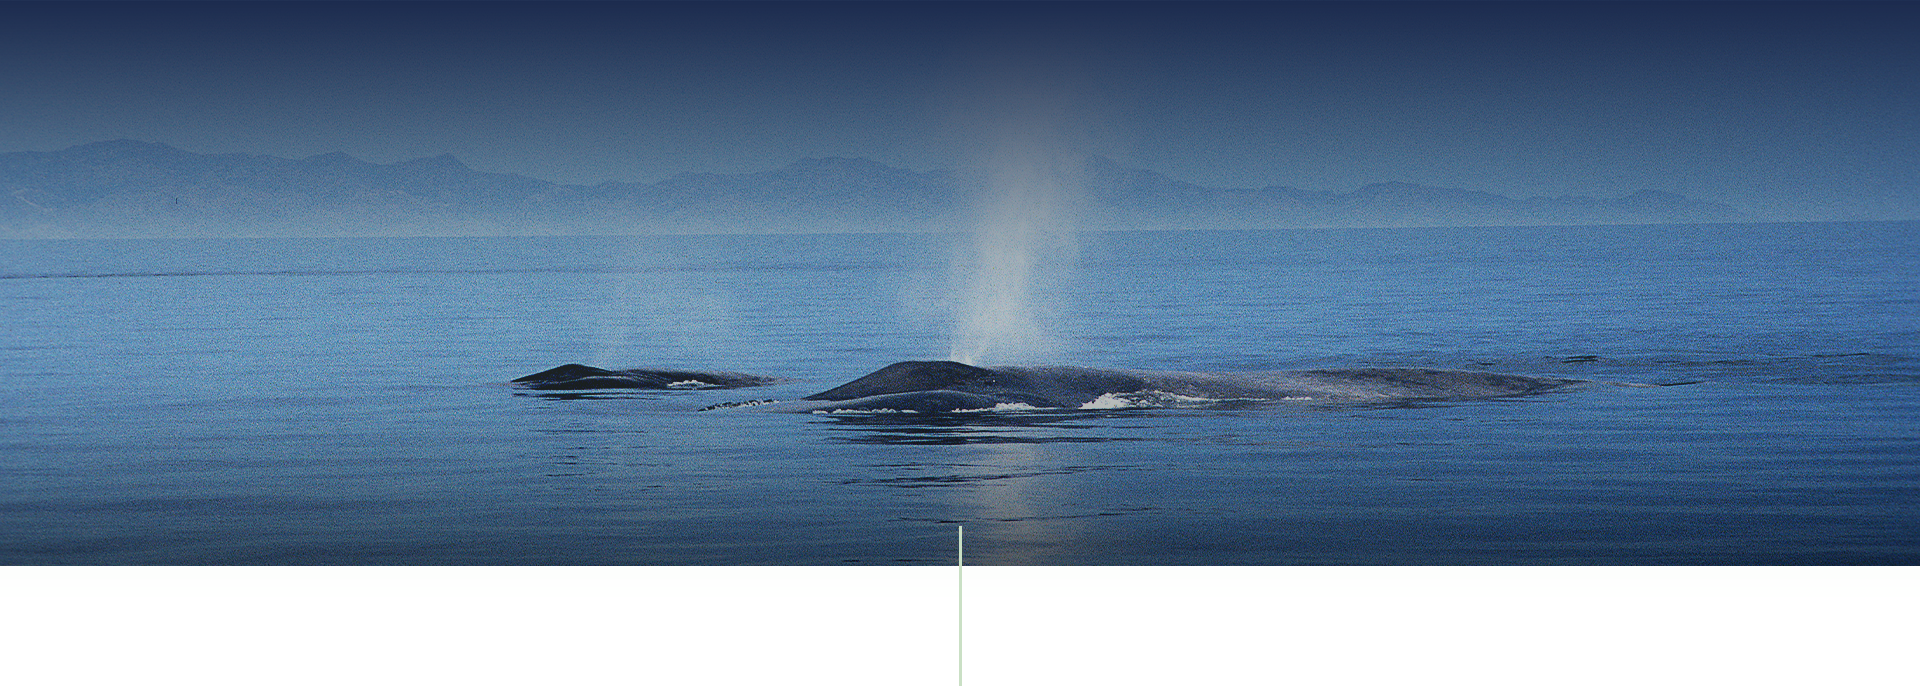
Sightings are important because they give us information about where and when particular species occur, from which we can identify important areas and habitats, as well as determine changes in their status and distribution. Such knowledge helps provide better informed conservation measures.
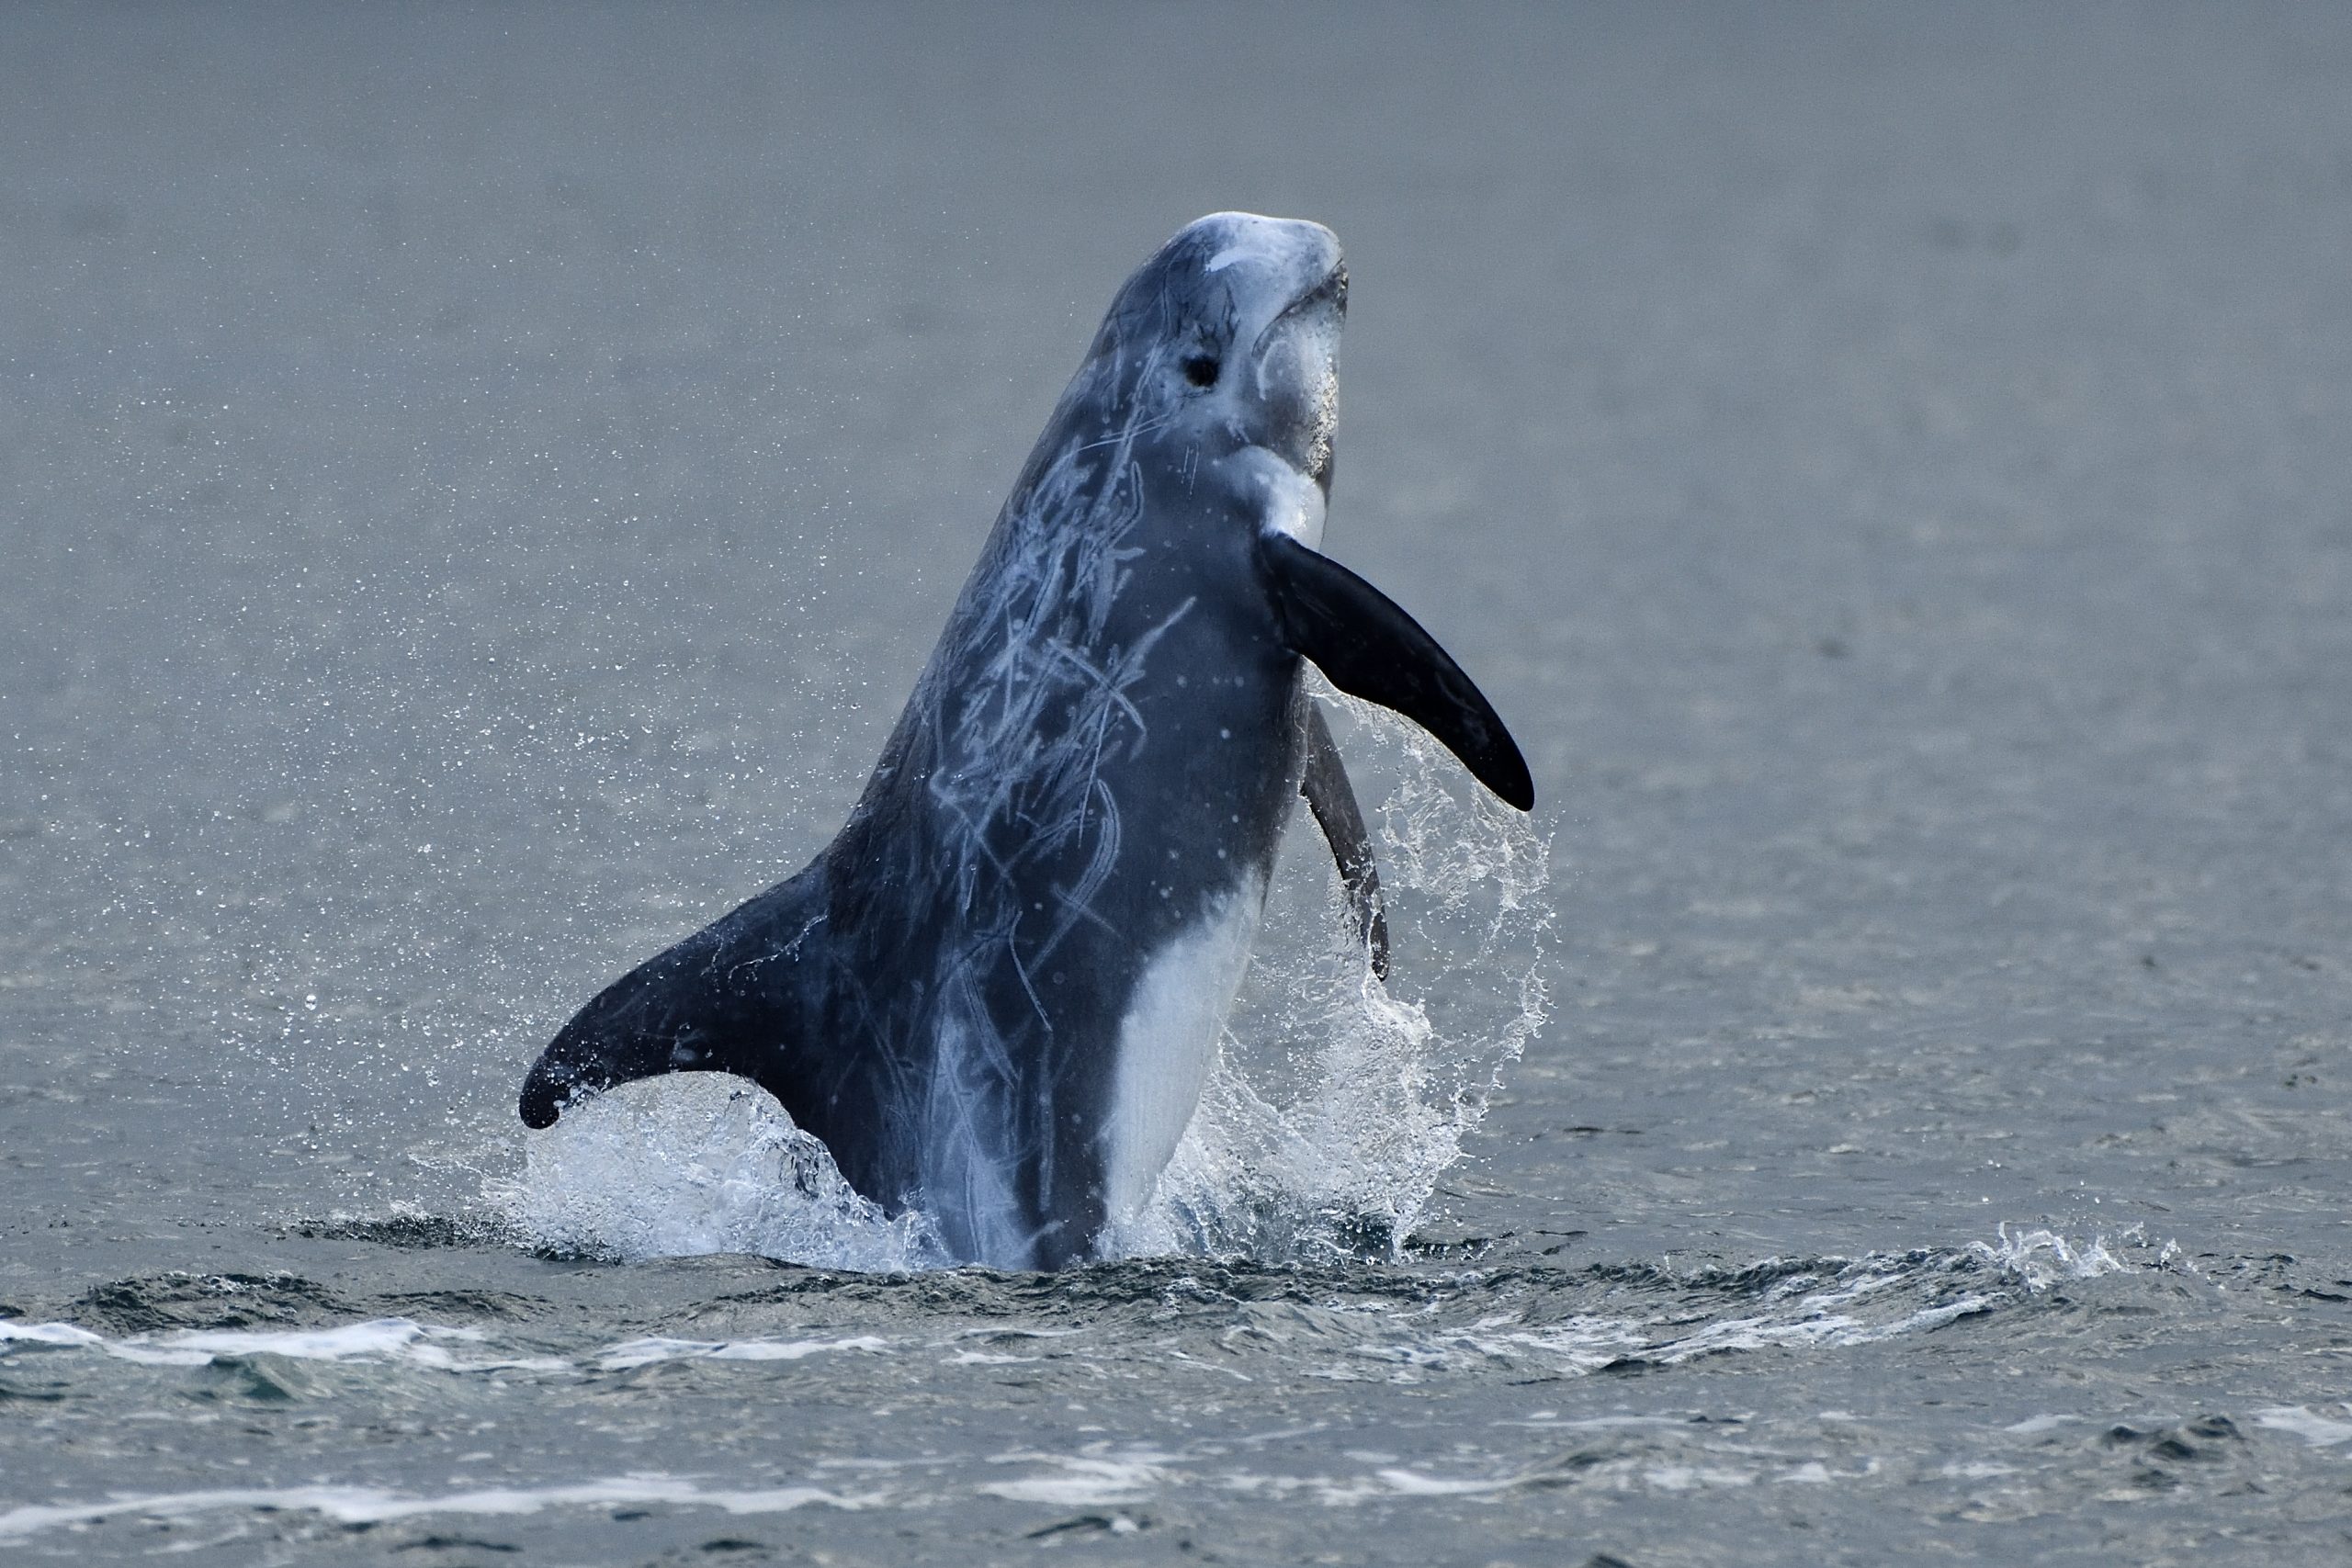
Risso’s Dolphin
Photo credit: I Jones
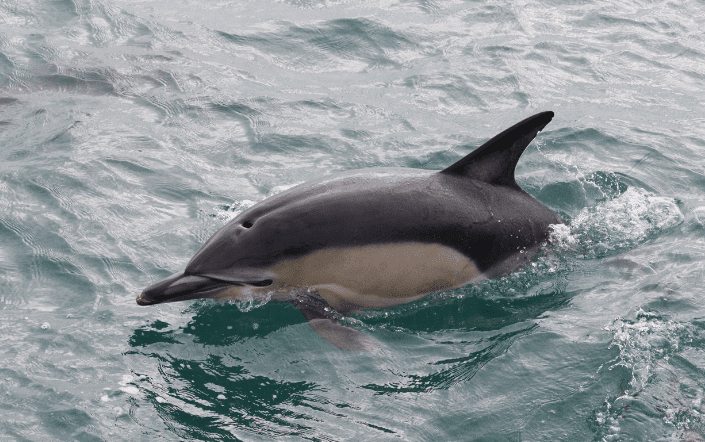
Common Dolphin
Photo credit: H Goodchild/Sea Watch Foundation
Casual sightings
 Cetacean Atlas - Common dolphin
 Cetacean Atlas - White-beaked dolphin
 Cetacean Atlas - Humpback whale
We welcome all sightings of whales, dolphins and porpoises, however common the species. Of course, it is important that identification to species is made and that mistakes are avoided (not always easy since species can appear rather similar to one another and often are seen only briefly). Knowing group size is also very important and yet frequently difficult to determine. Sea conditions can affect both detecting and identifying animals so need to be recorded, along with the date, time of day, and location.
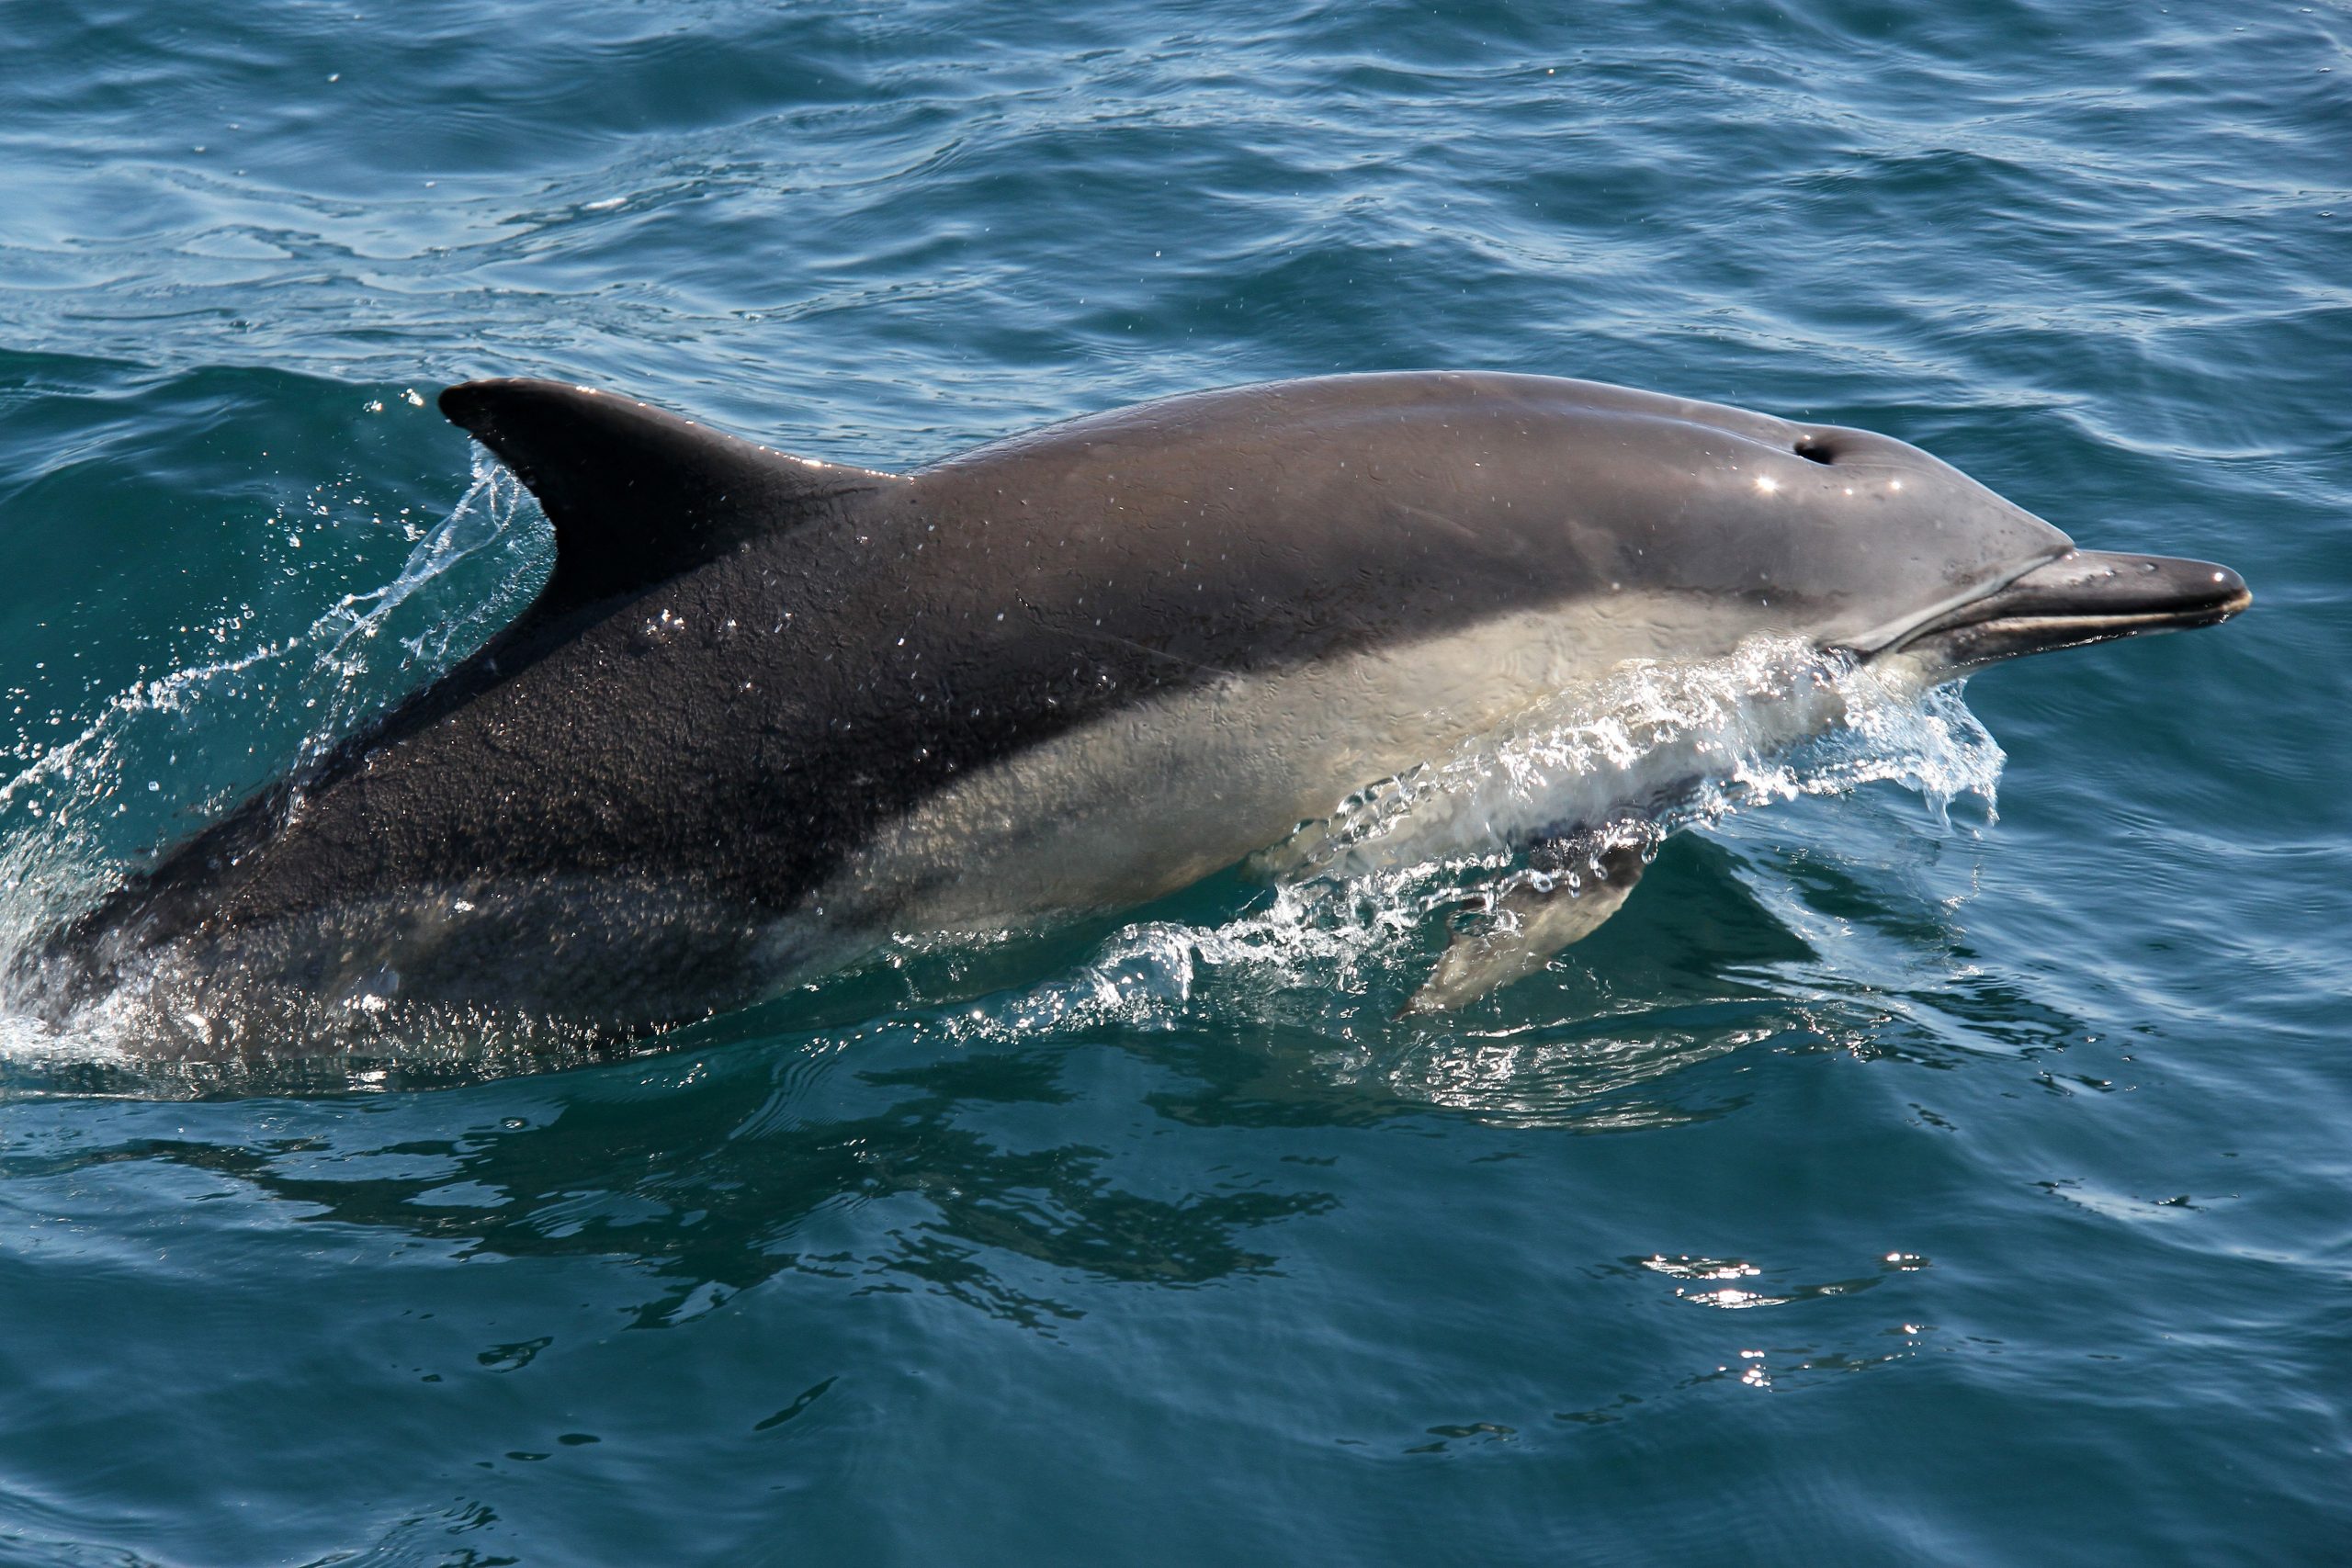
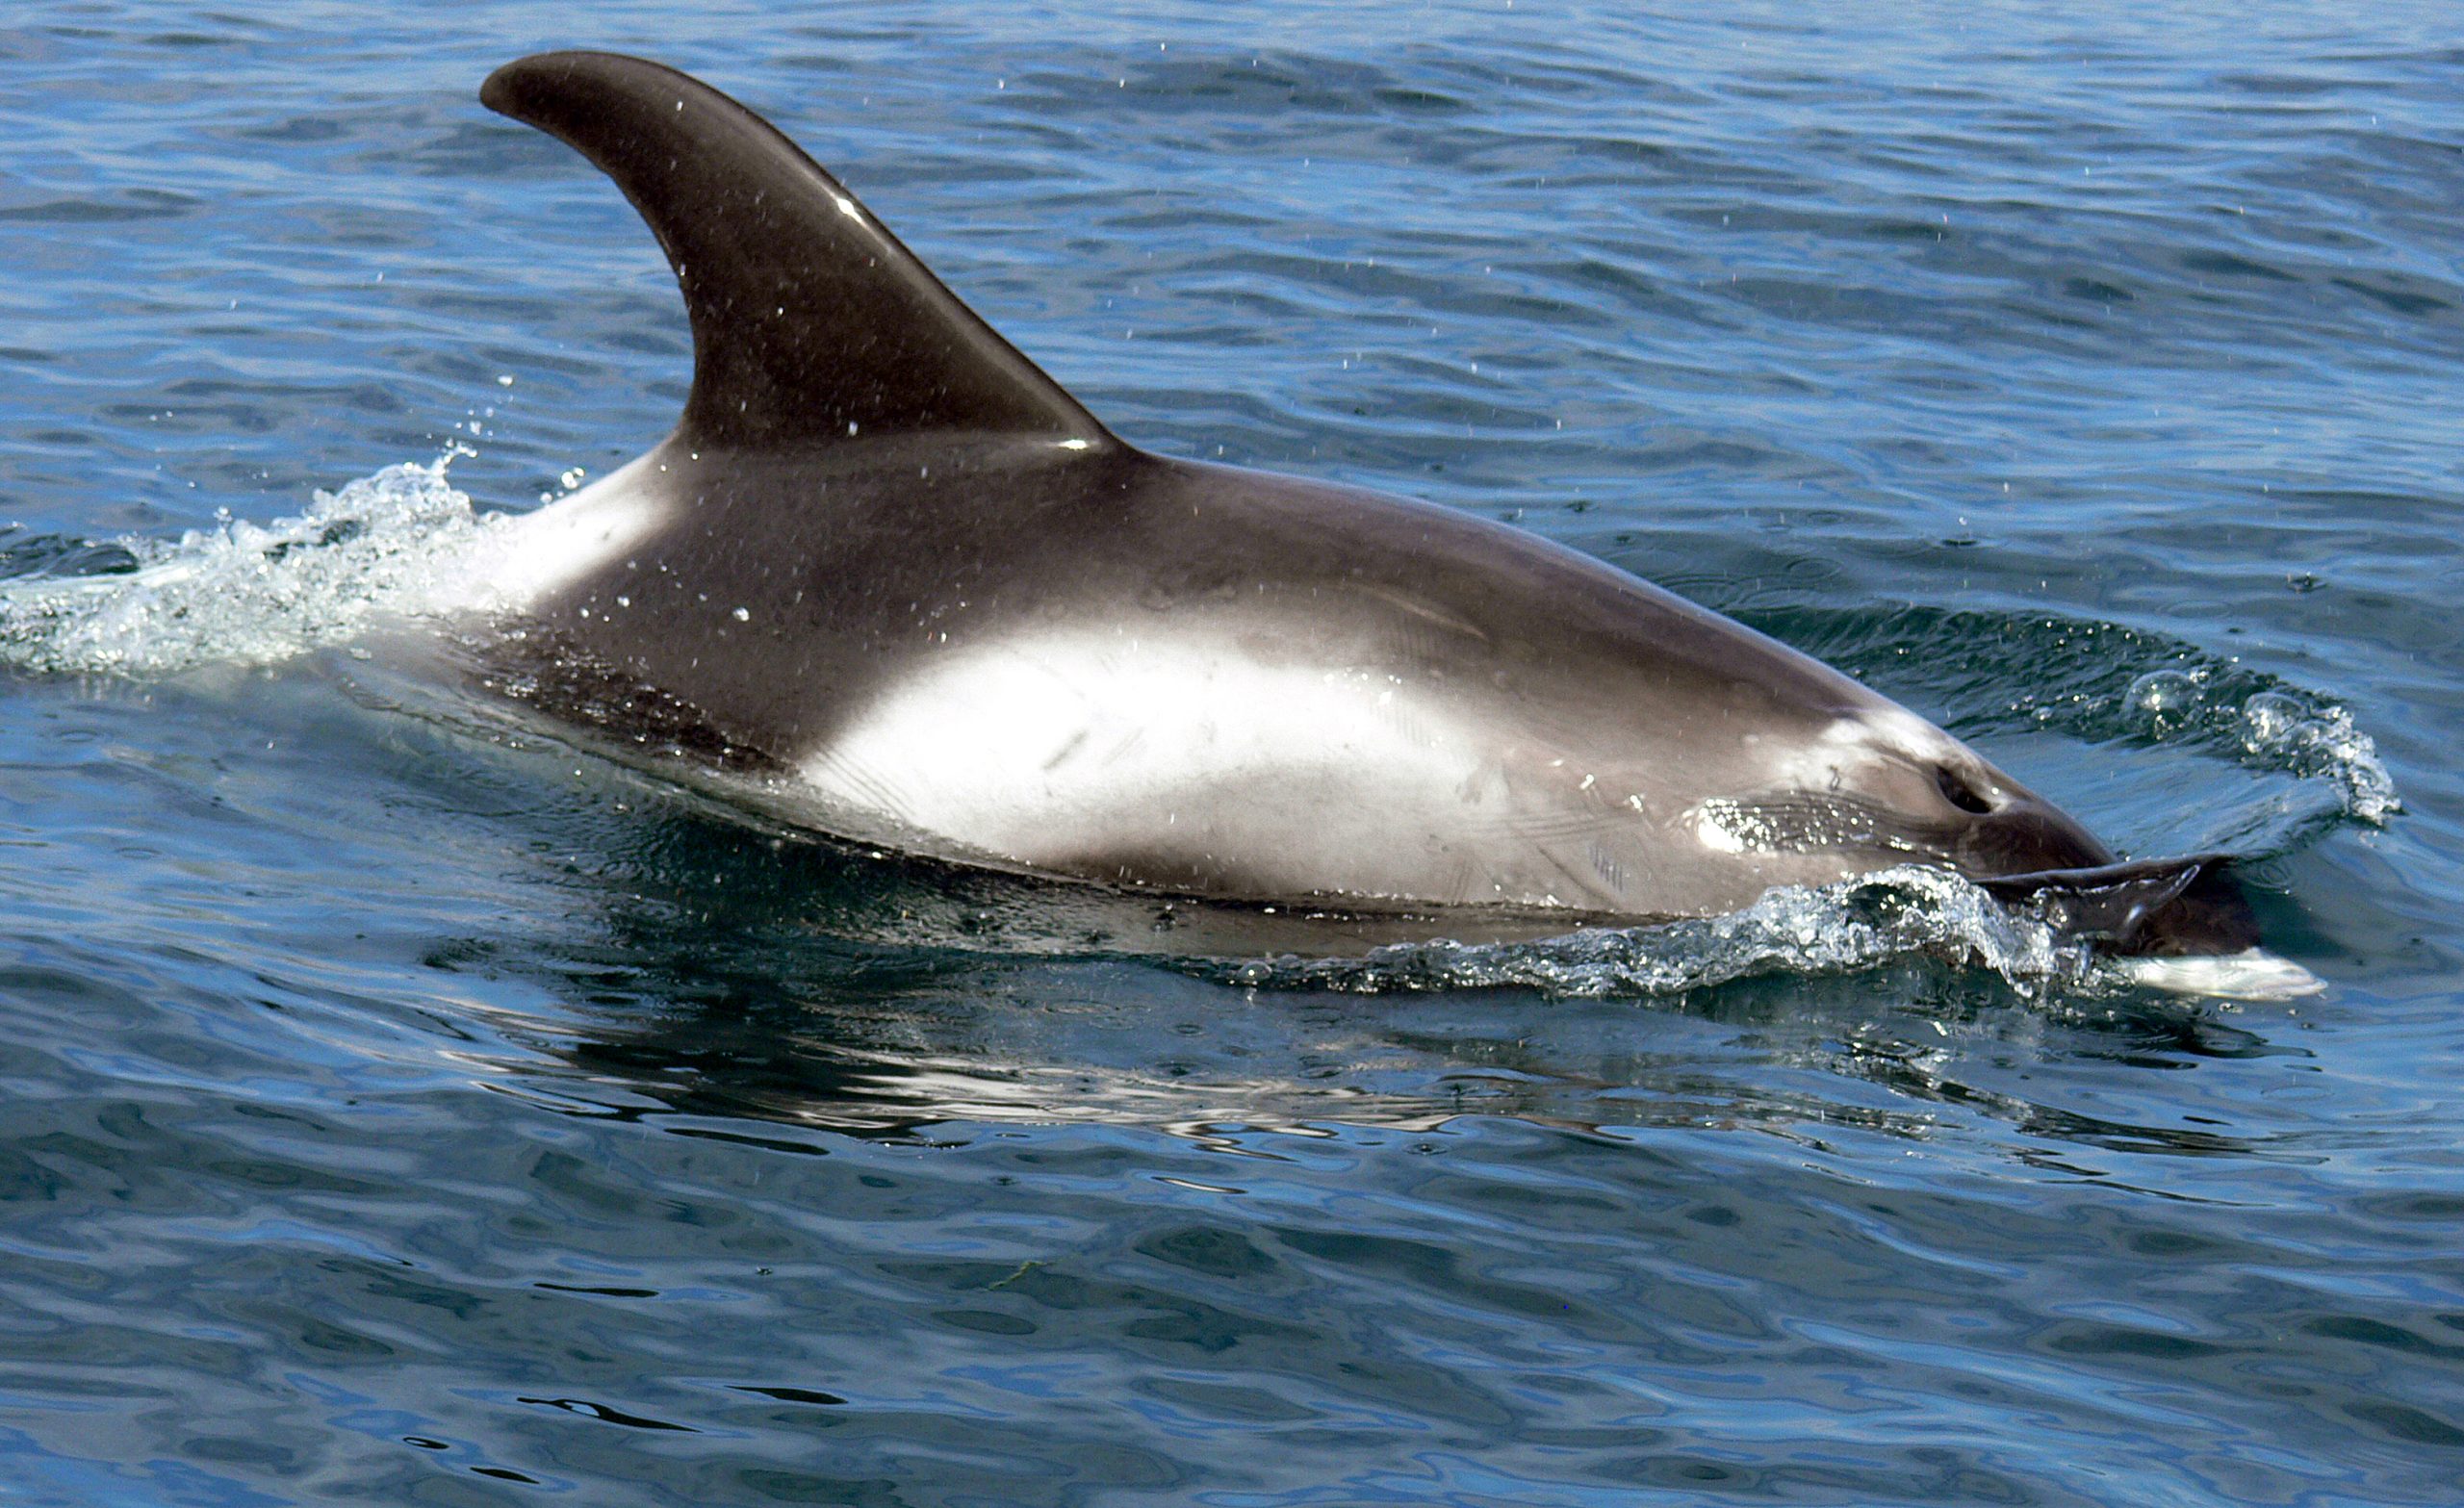
Common Dolphin
Photo credit: PHG Evans / Sea Watch Foundation
White-beaked Dolphin
Photo credit: K Hepworth / Sea Watch Foundation
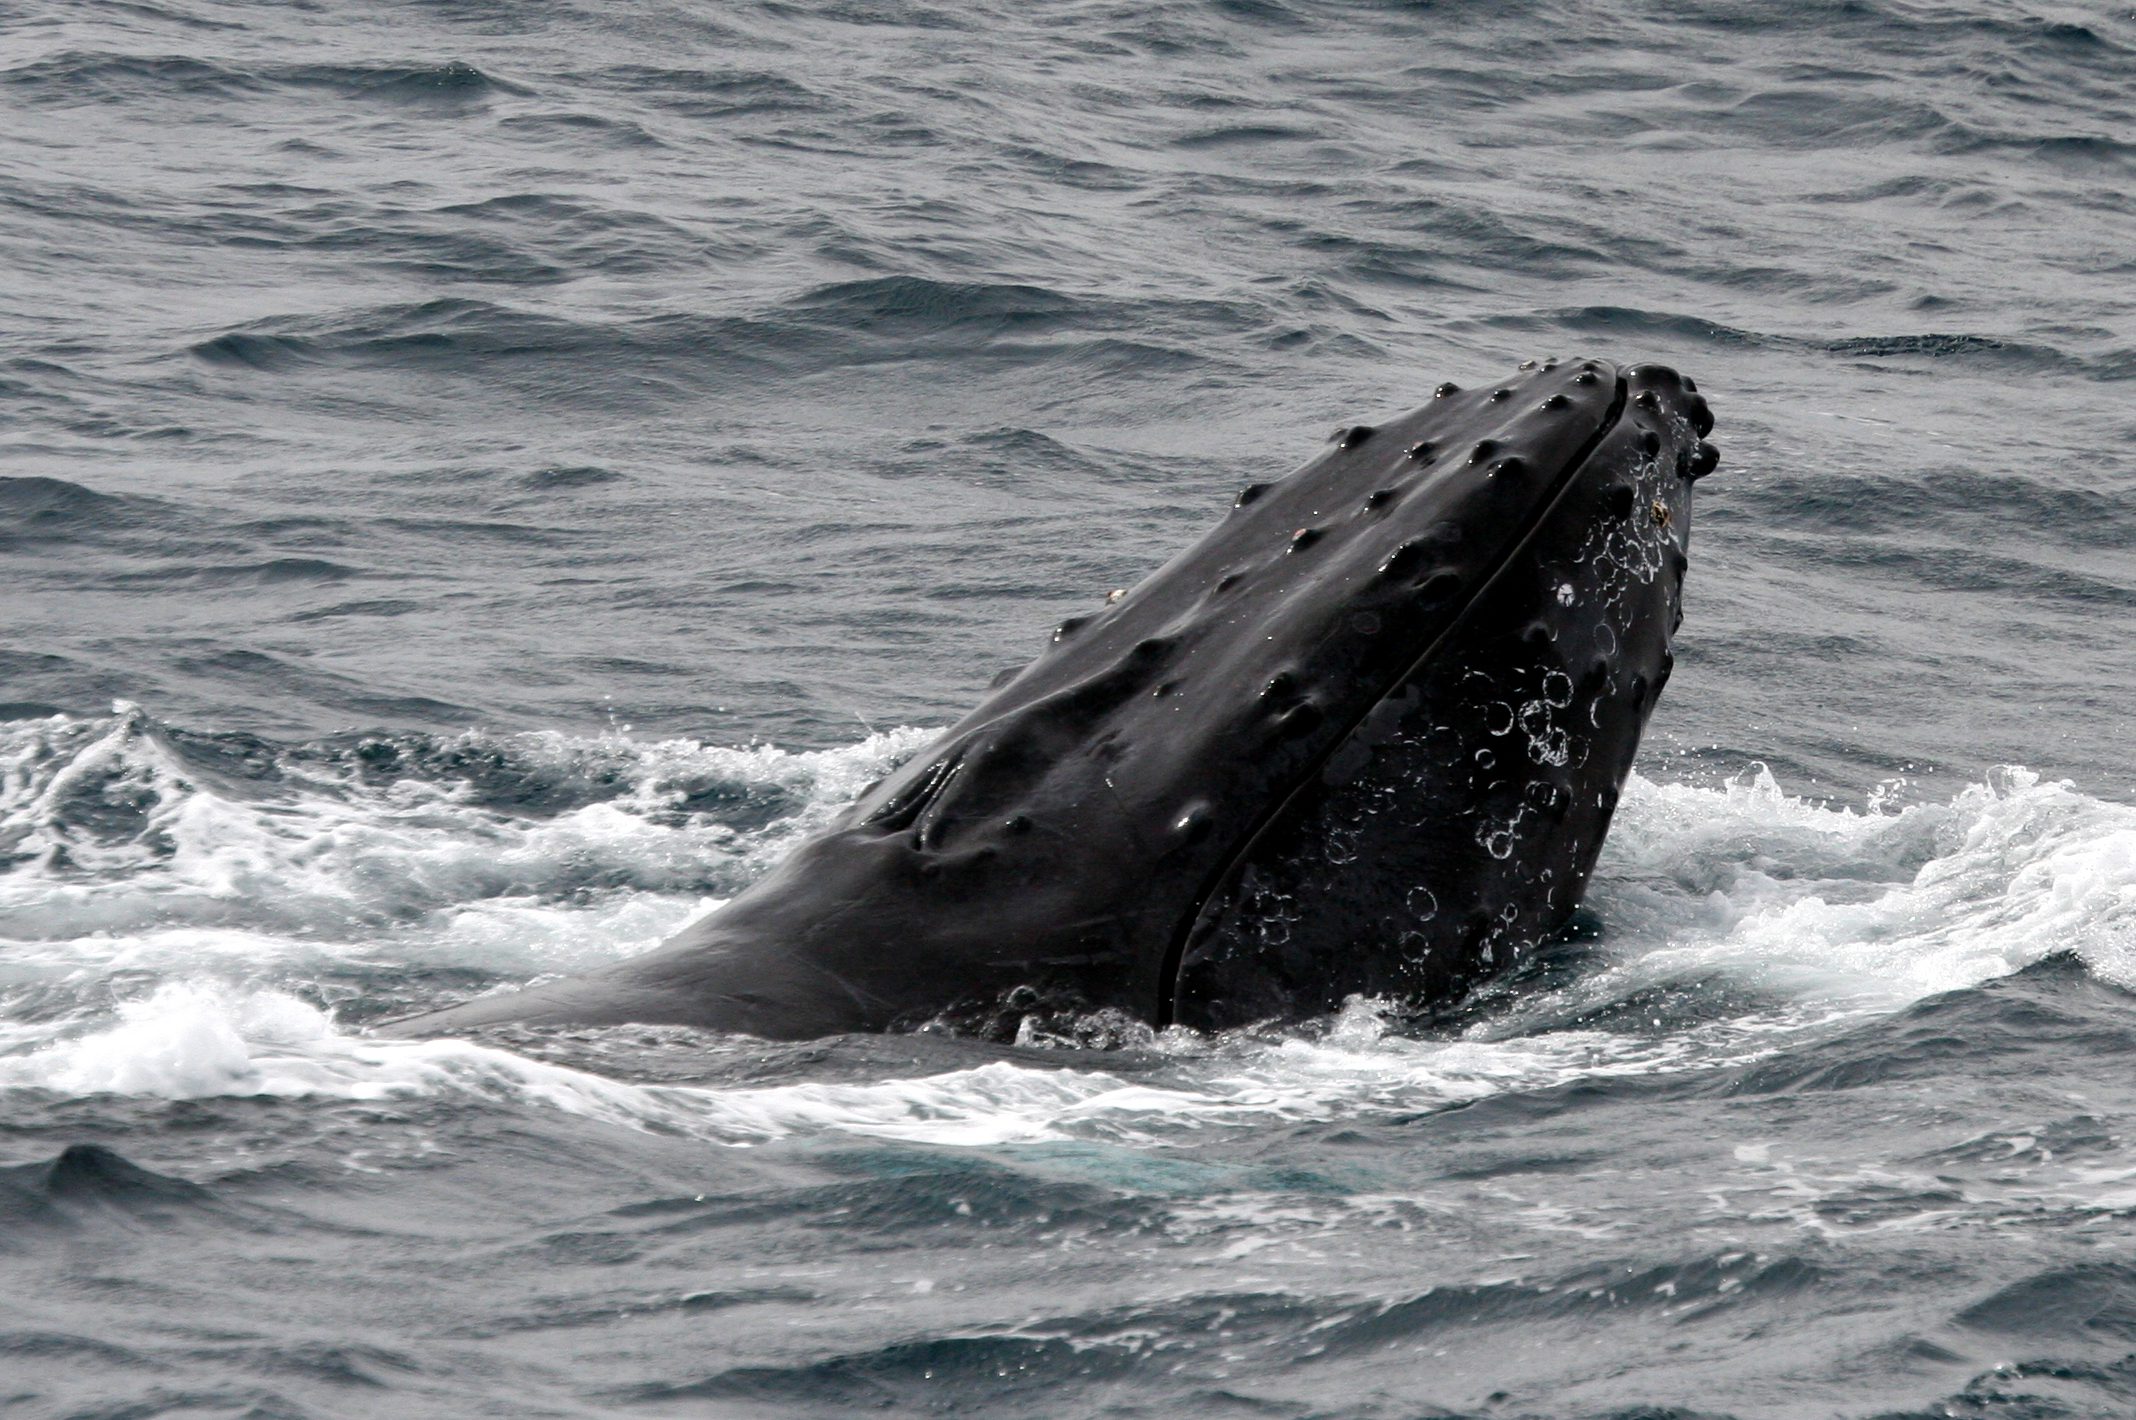
Humpback Whale
Photo credit: PGH Evans / Sea Watch Foundation
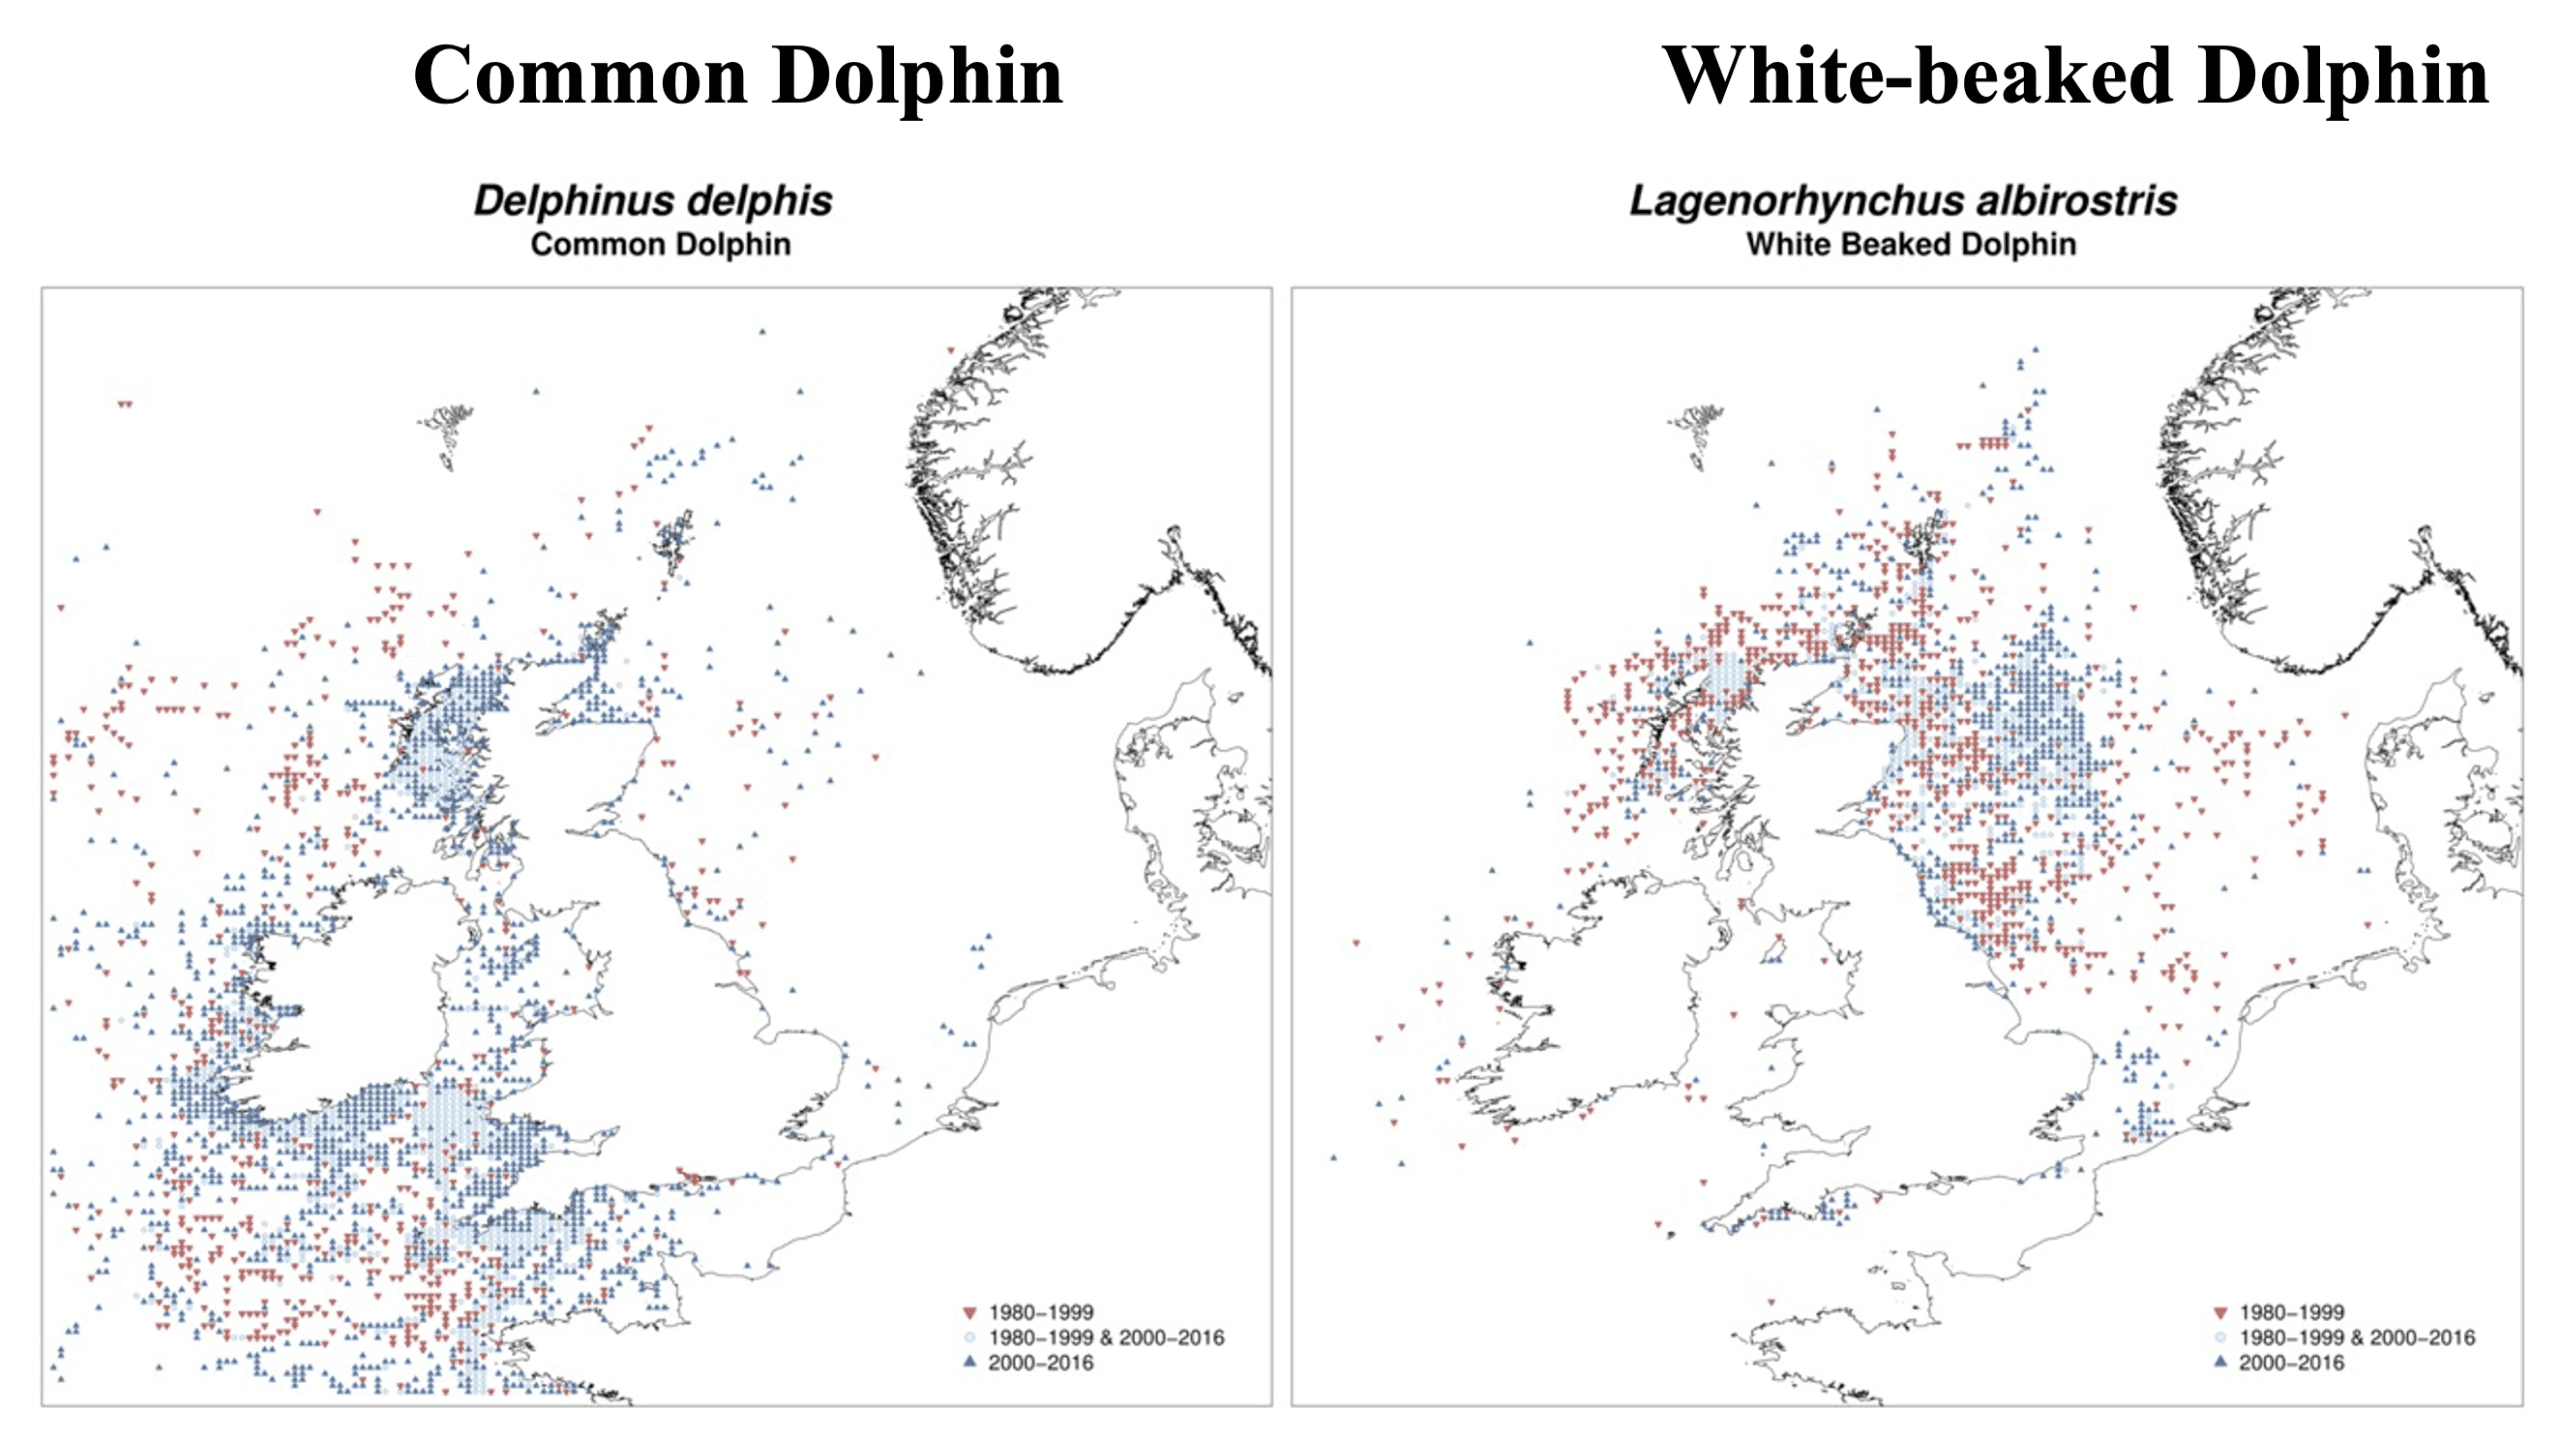
Common dolphin and white-beaked dolphin sightings from 1980-2016.
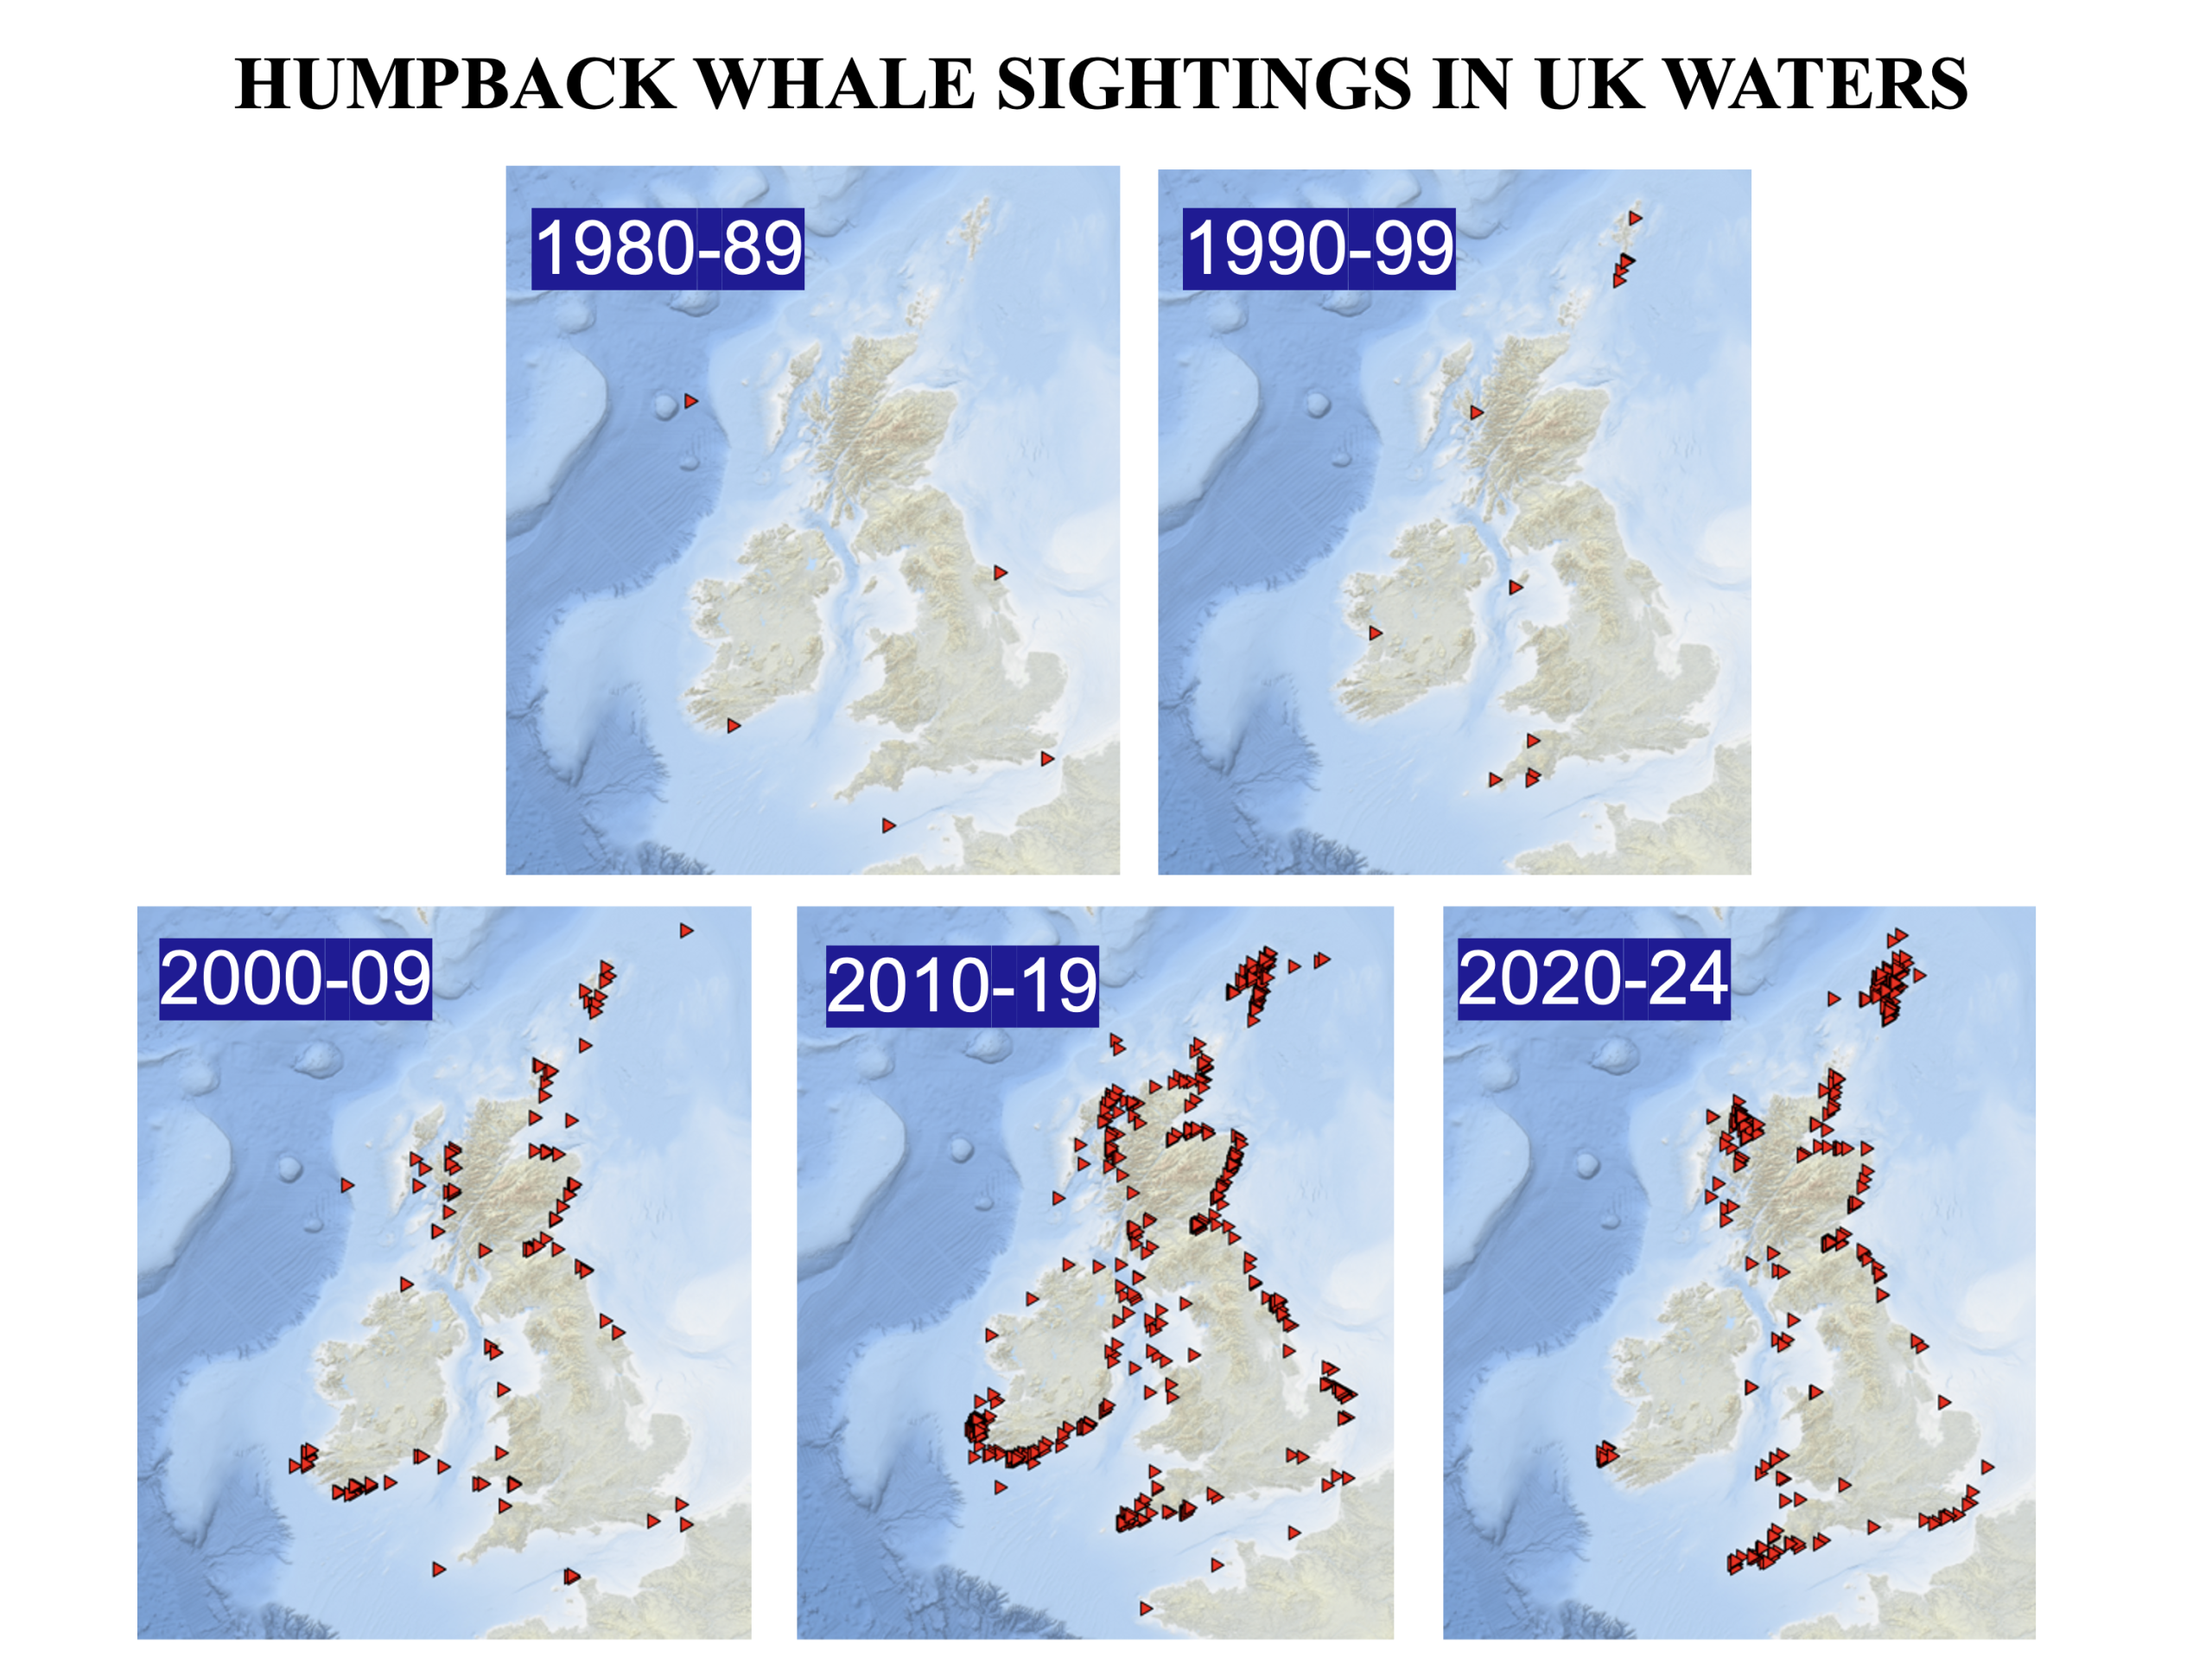
Humpback whale sightings from 1980-2024.
Watching from land
Although casual sightings help us obtain a general impression of the distribution of species and any trends in occurrence, it can also mislead us. If there are many hours spent watching in a particular area or time of year, inevitably more cetaceans will be seen than in an area that has not been watched. For this reason, it is really important that you record when you start and finish any watches dedicated to trying to spot animals. We can then calculate how many sightings and number of individuals are spotted in a specified period of time, for example number per hour of watching. Again, it is important though to record the sea conditions, group size, date, time of day, and location.
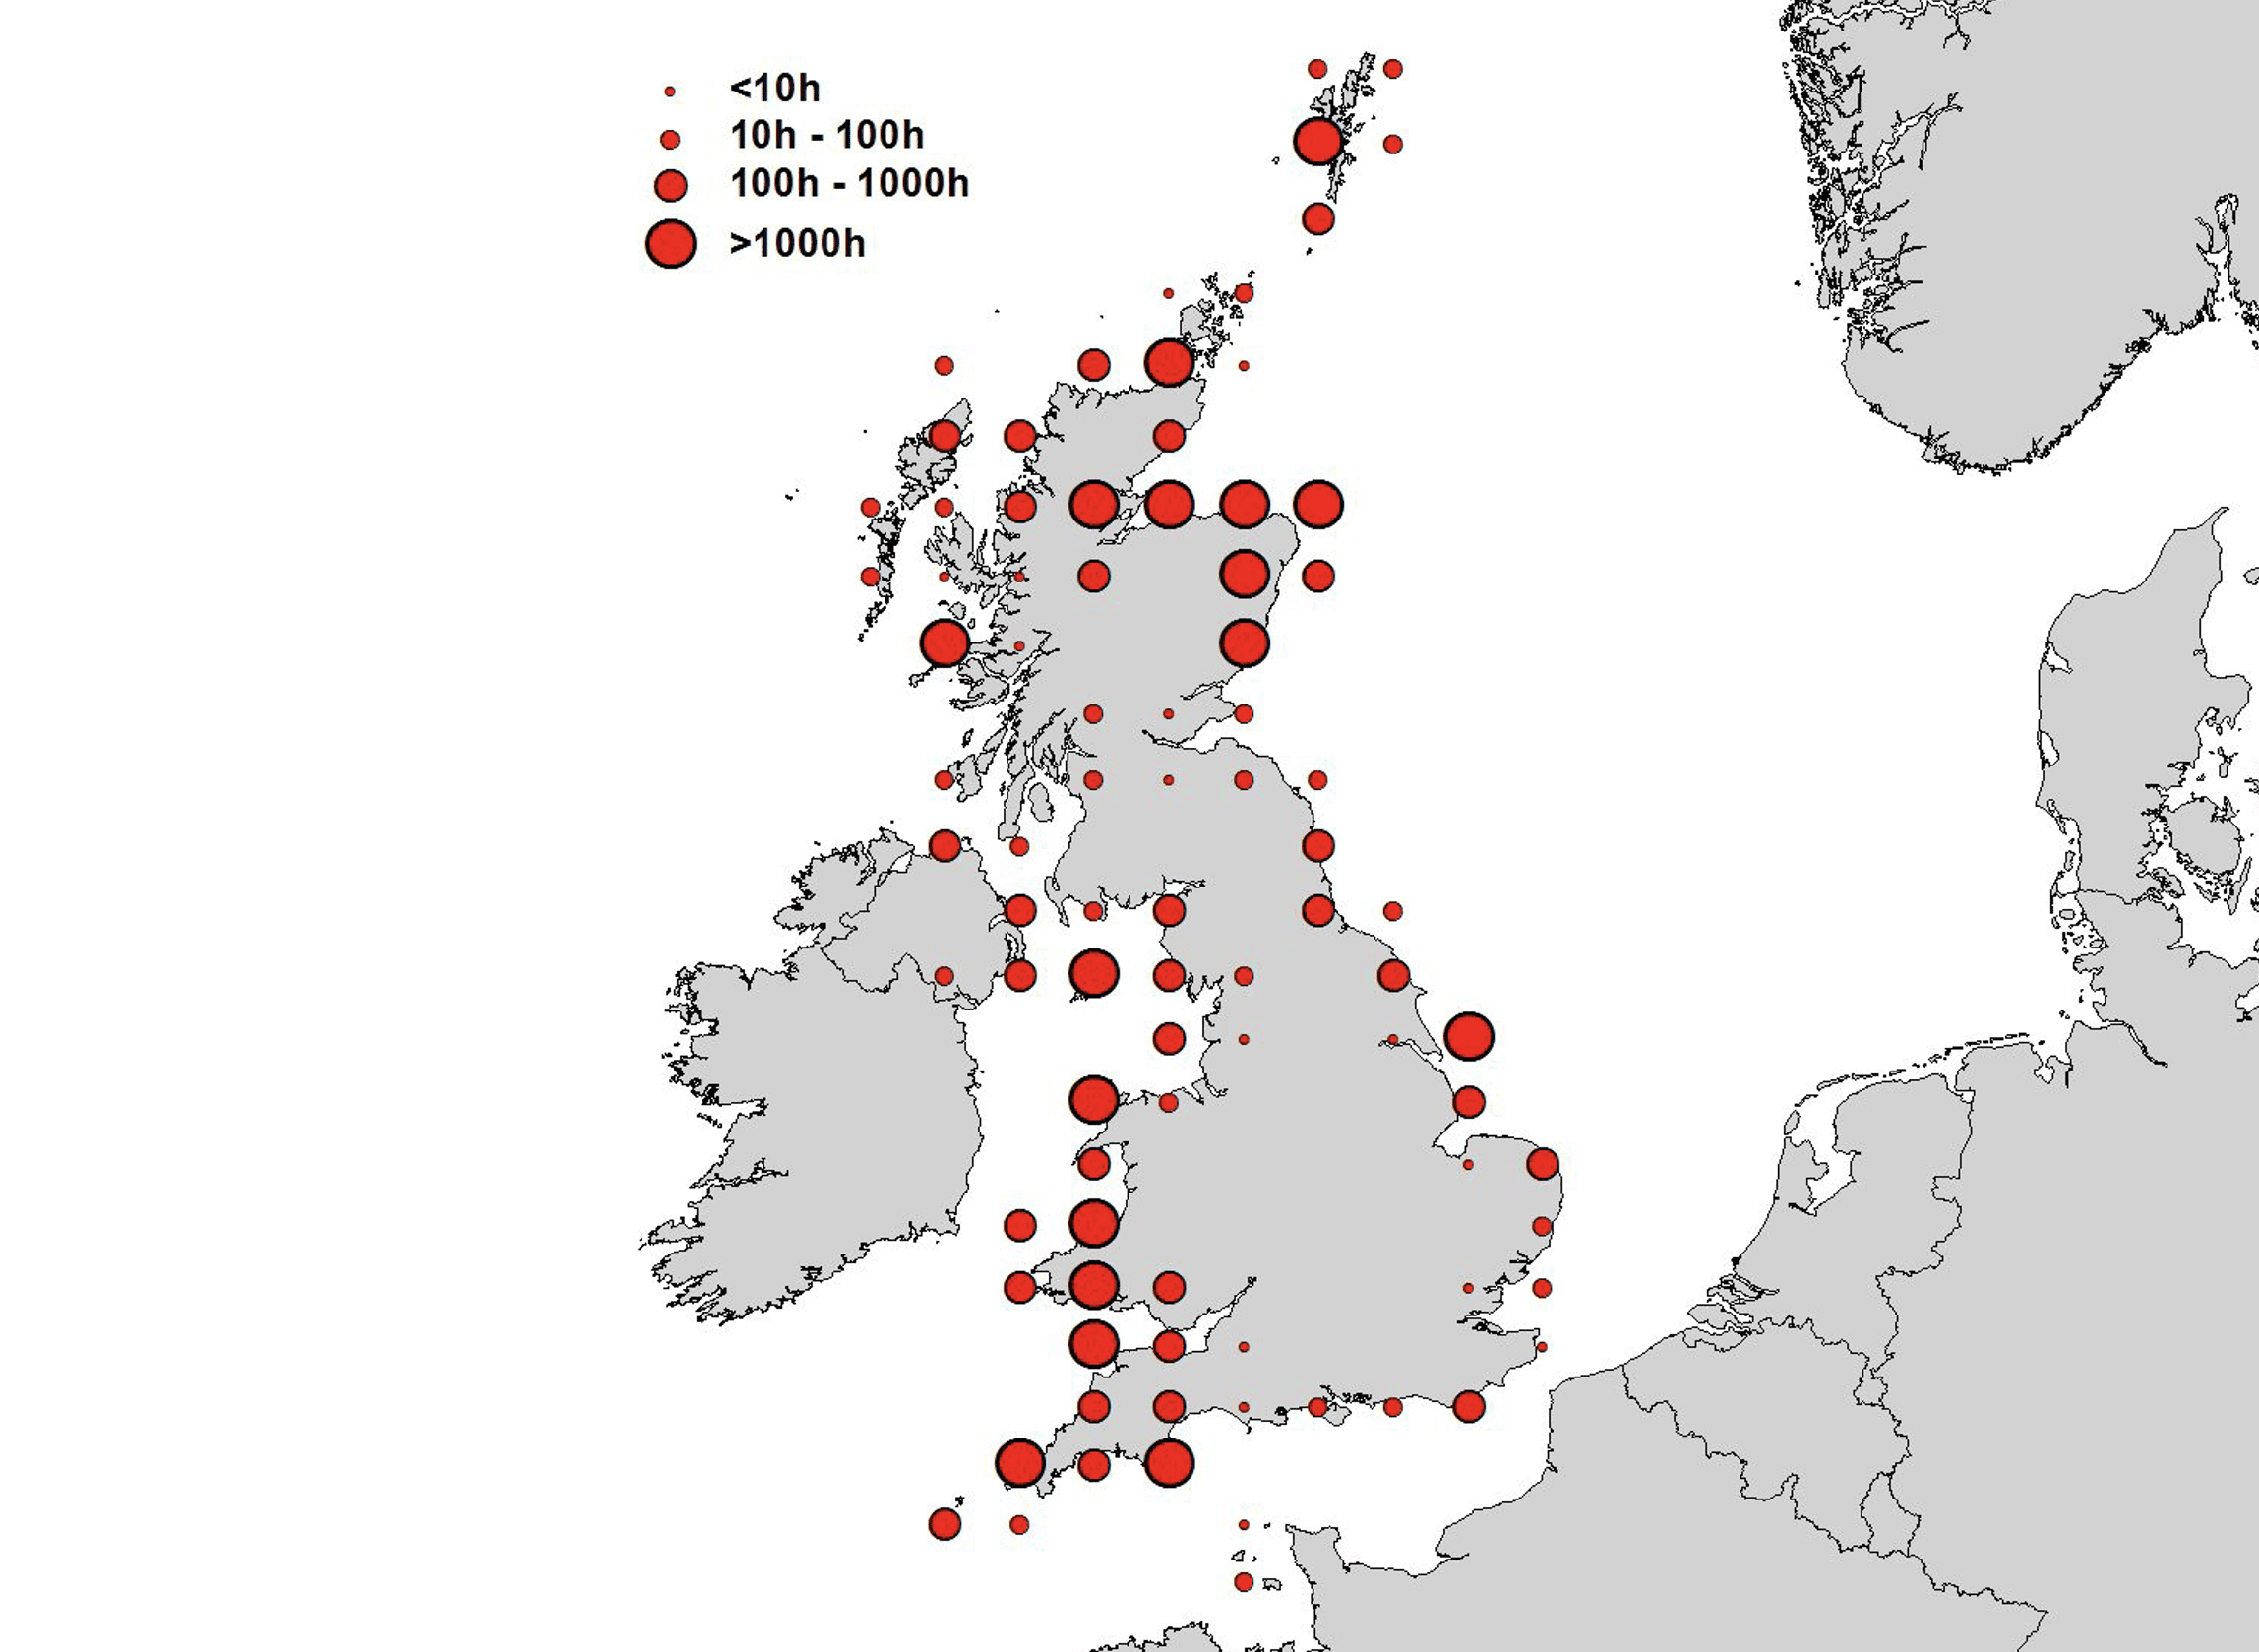
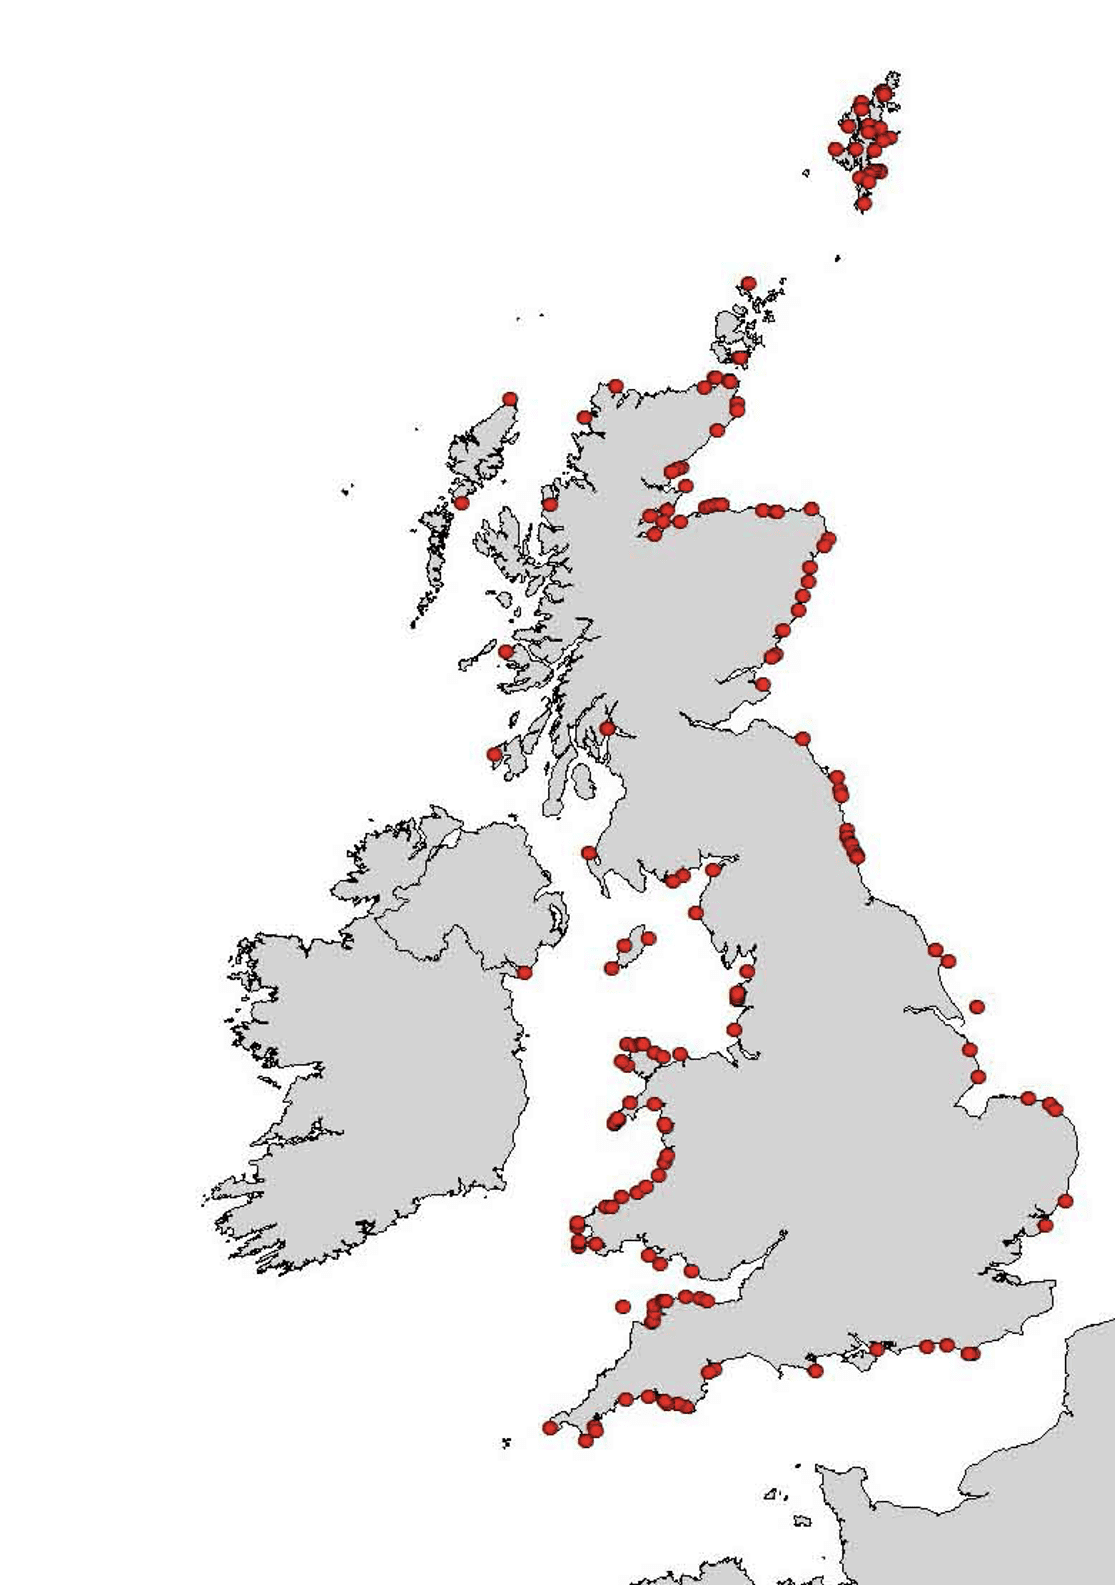
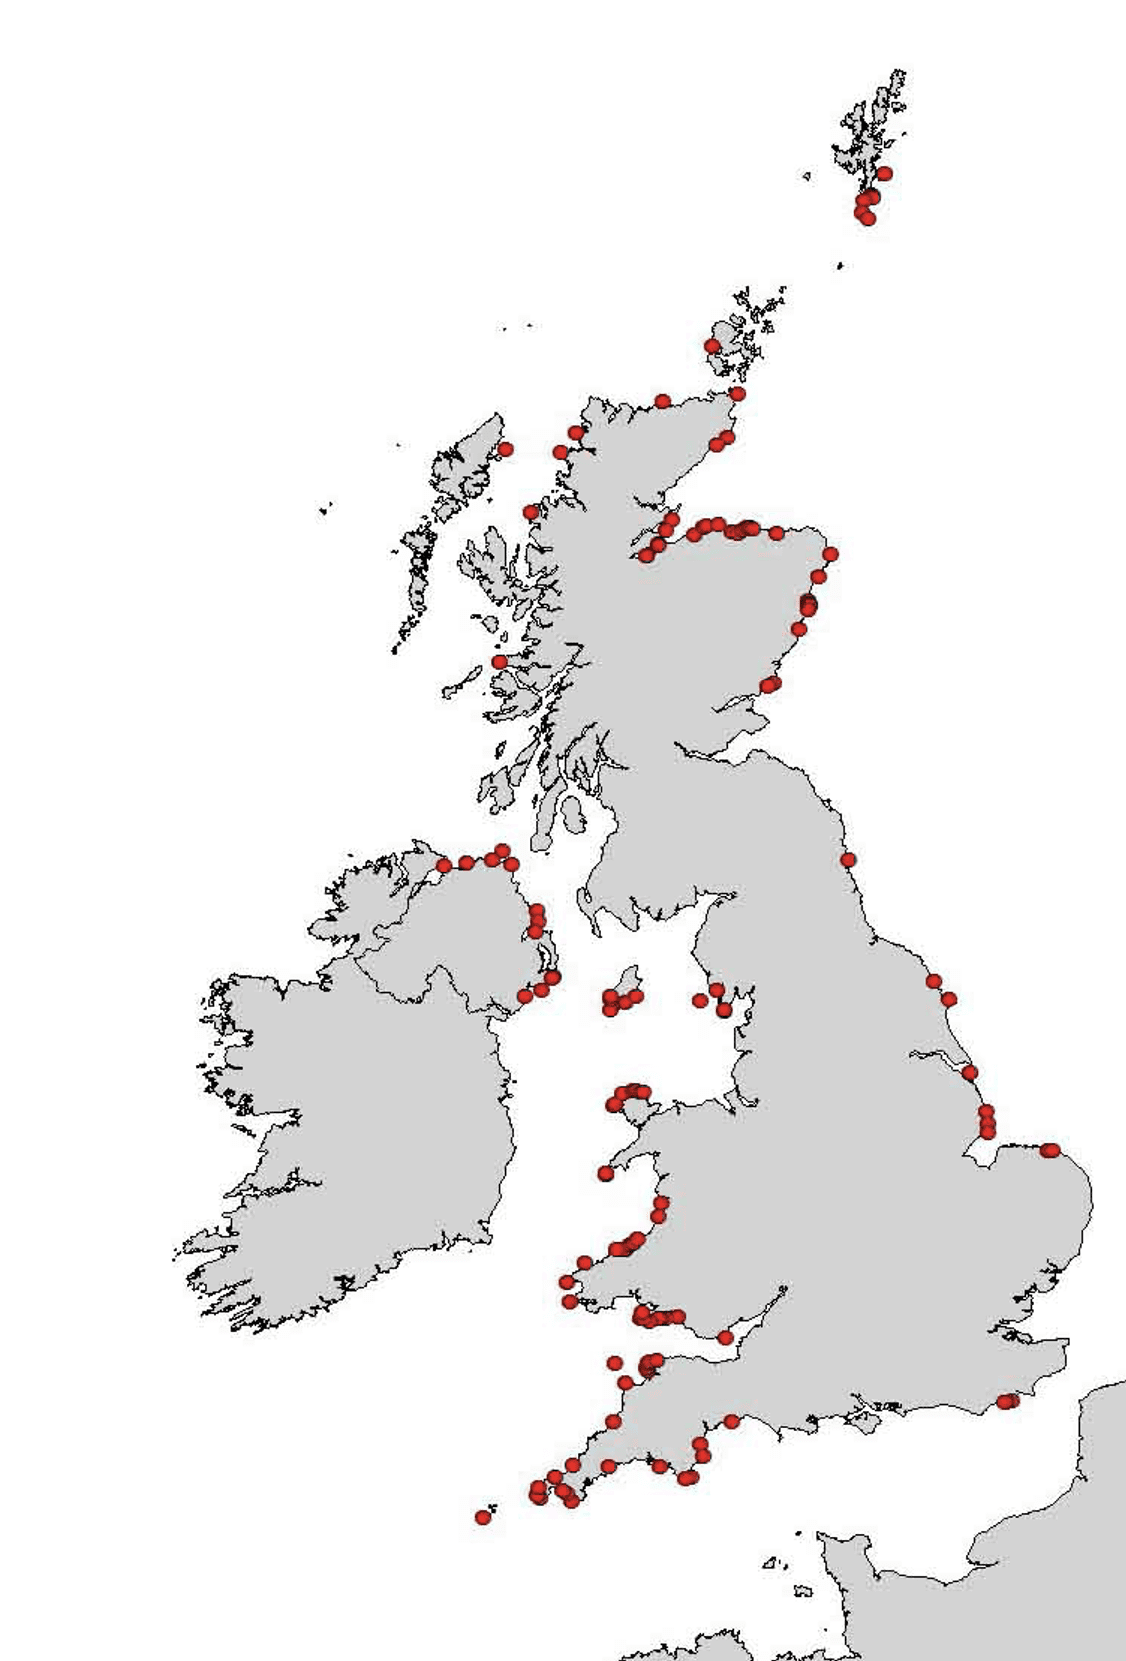
Below are maps taken from the JNCC 2016 report.
UK land survey coverage
UK land survey coverage between 10-50 hours
UK land survey coverage over 50 hours
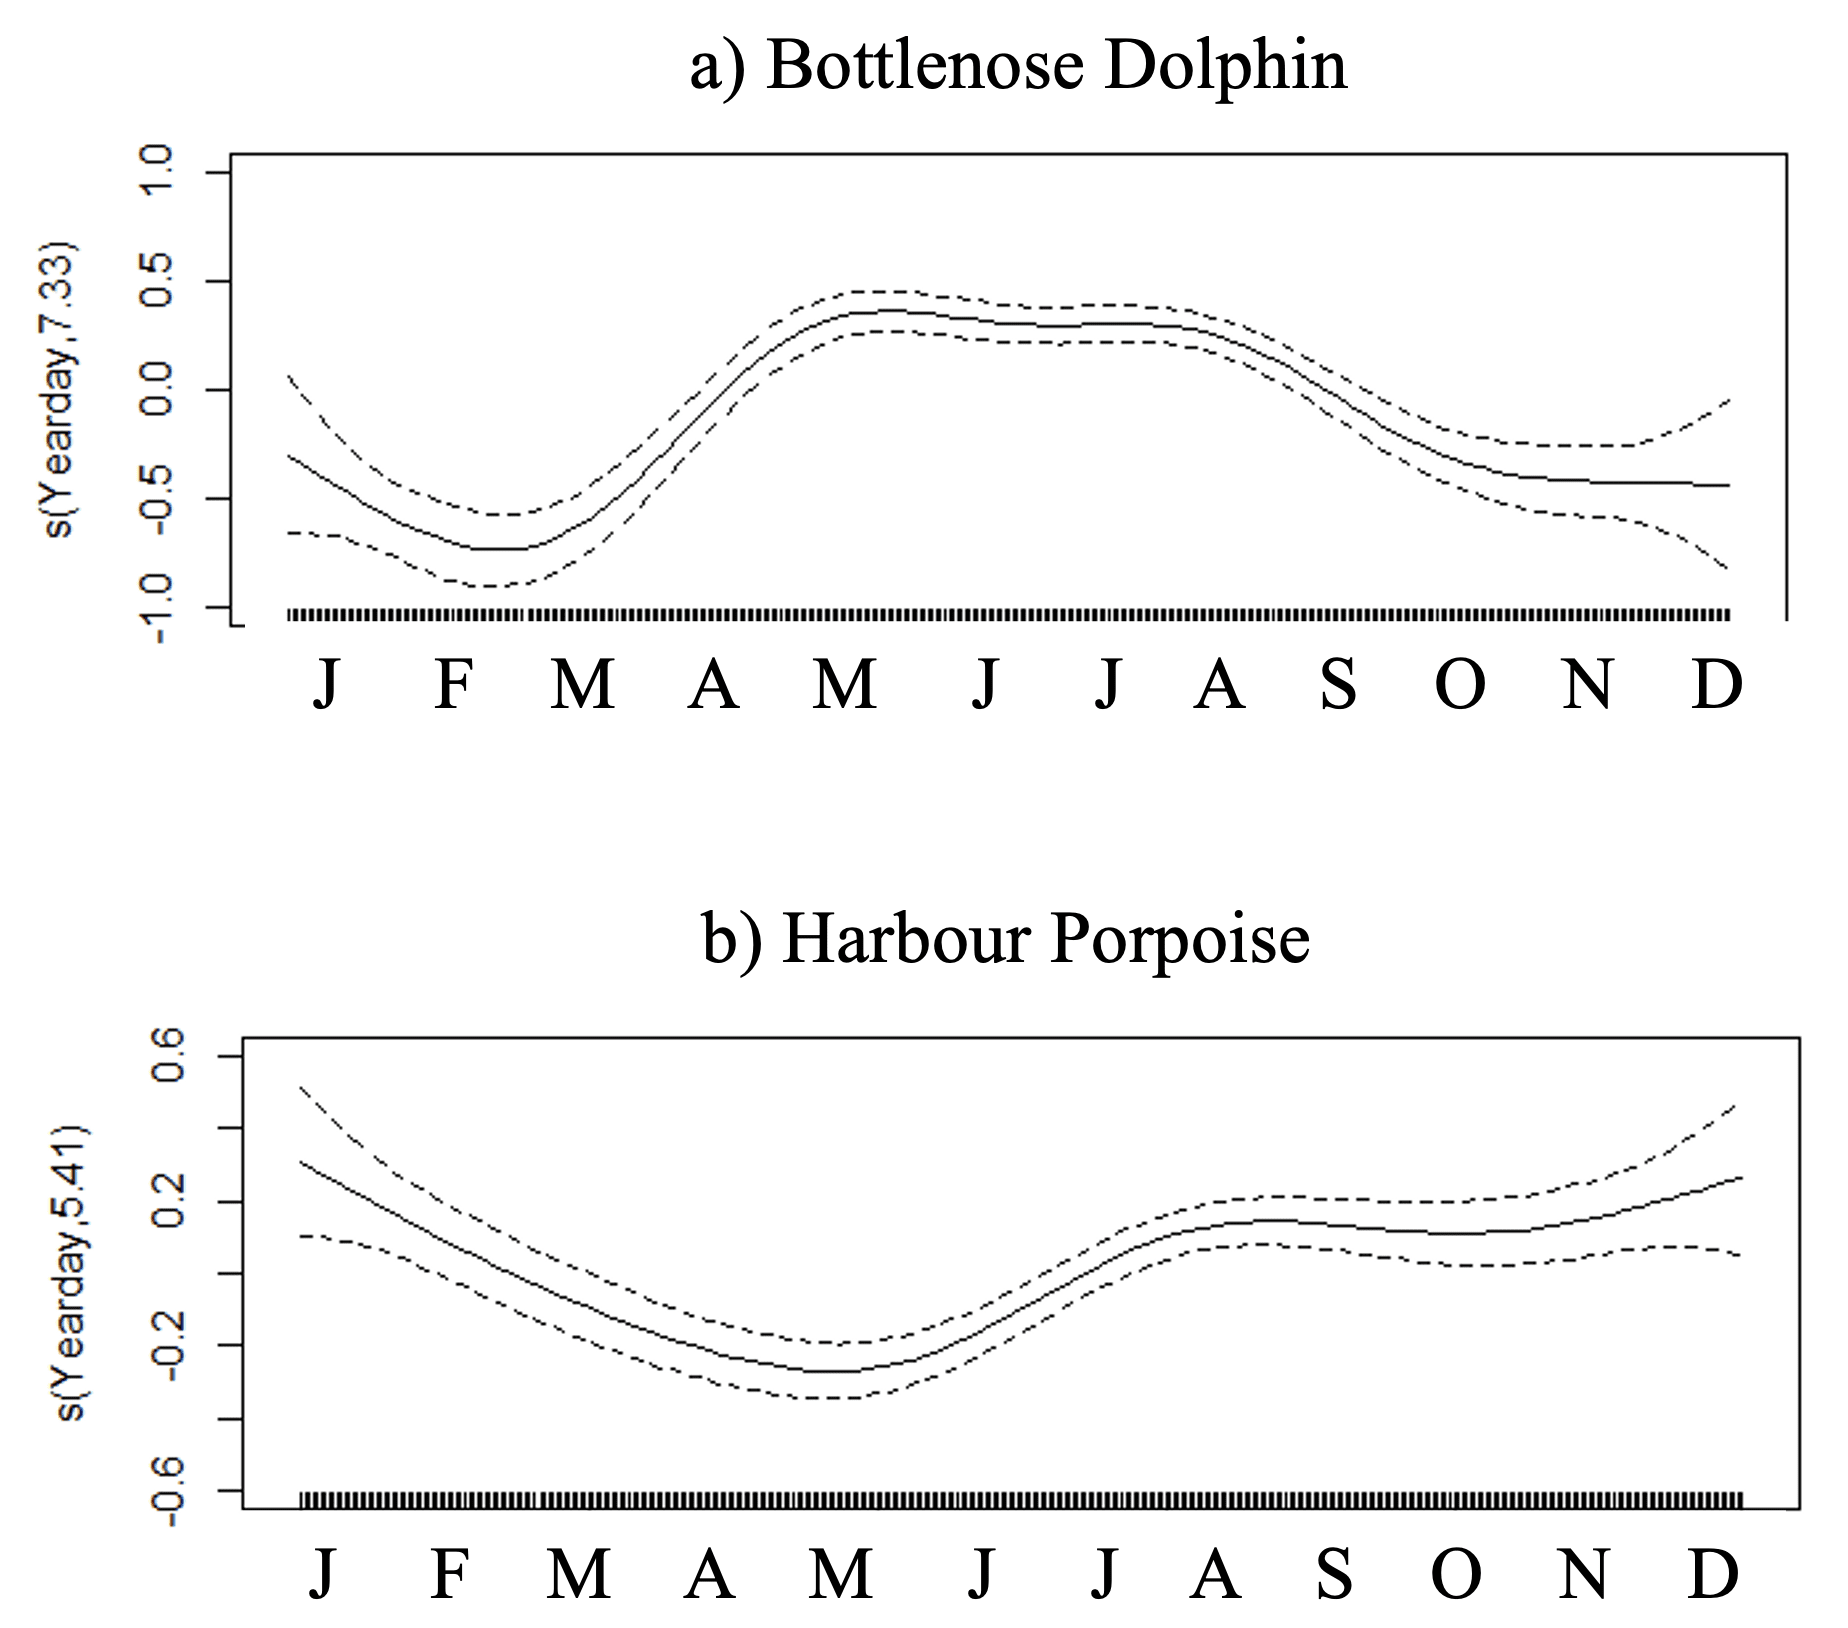
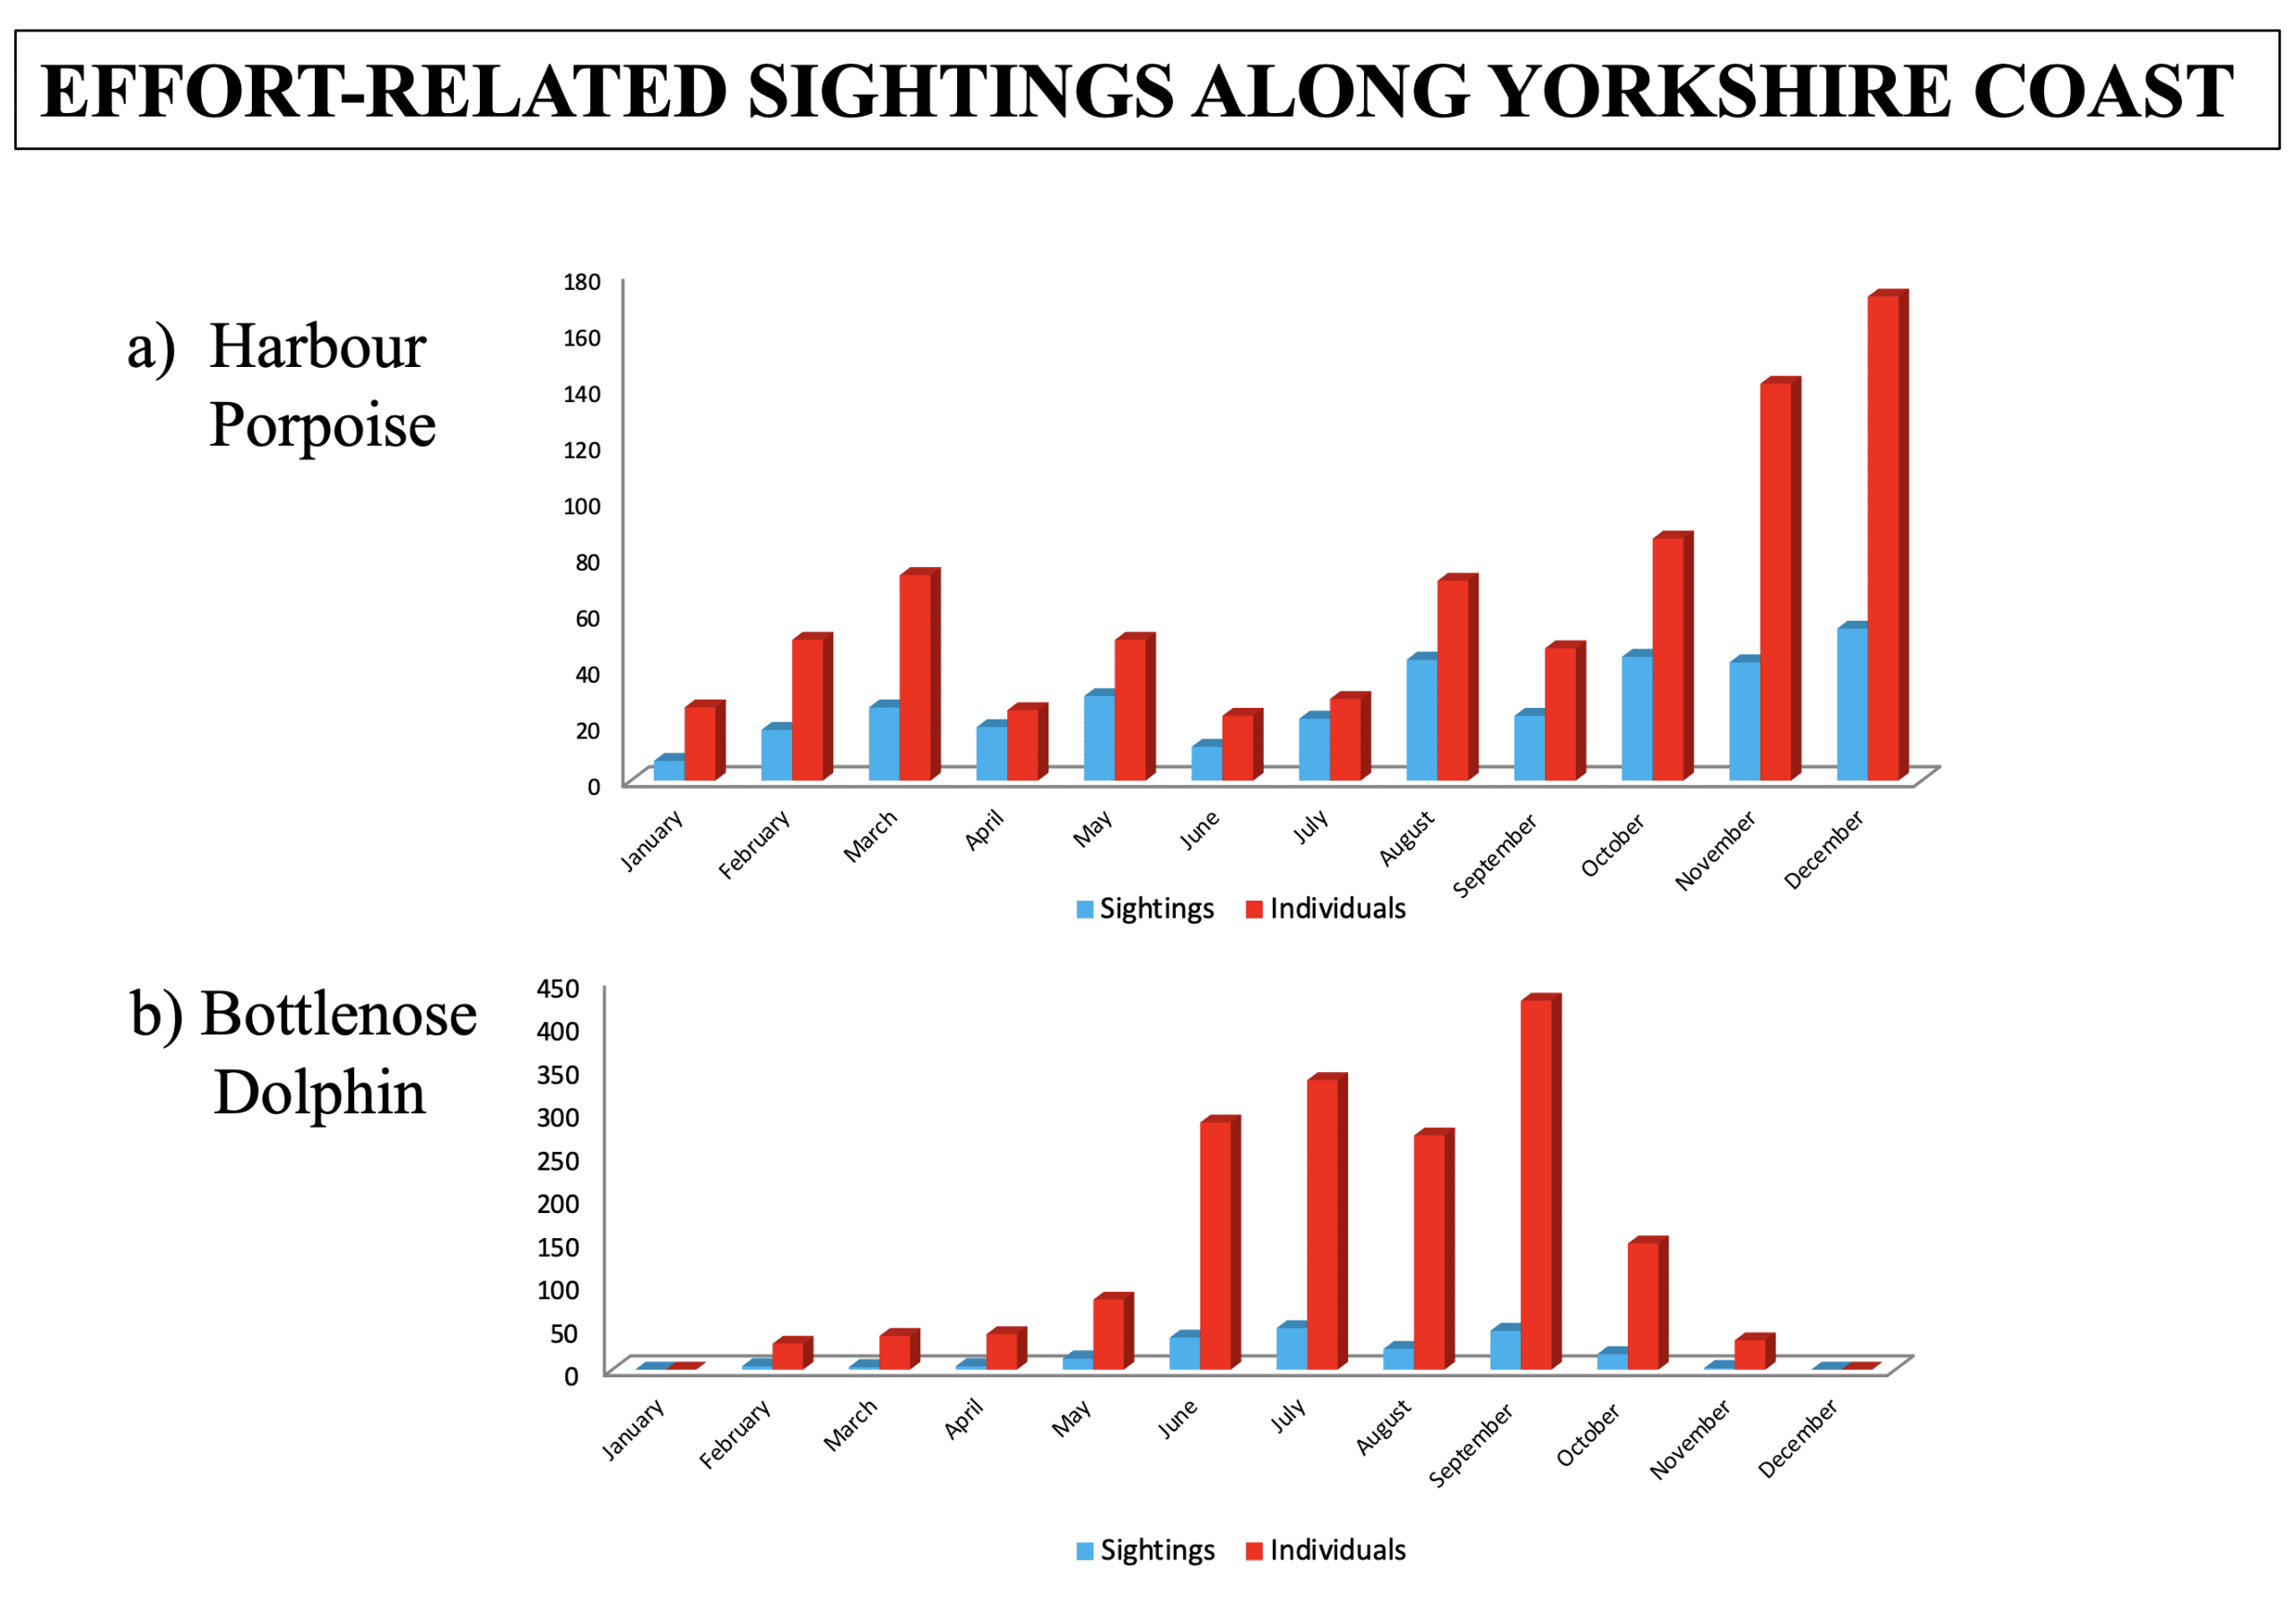
Monthly trends of bottlenose dolphins and harbour porpoise in the UK.
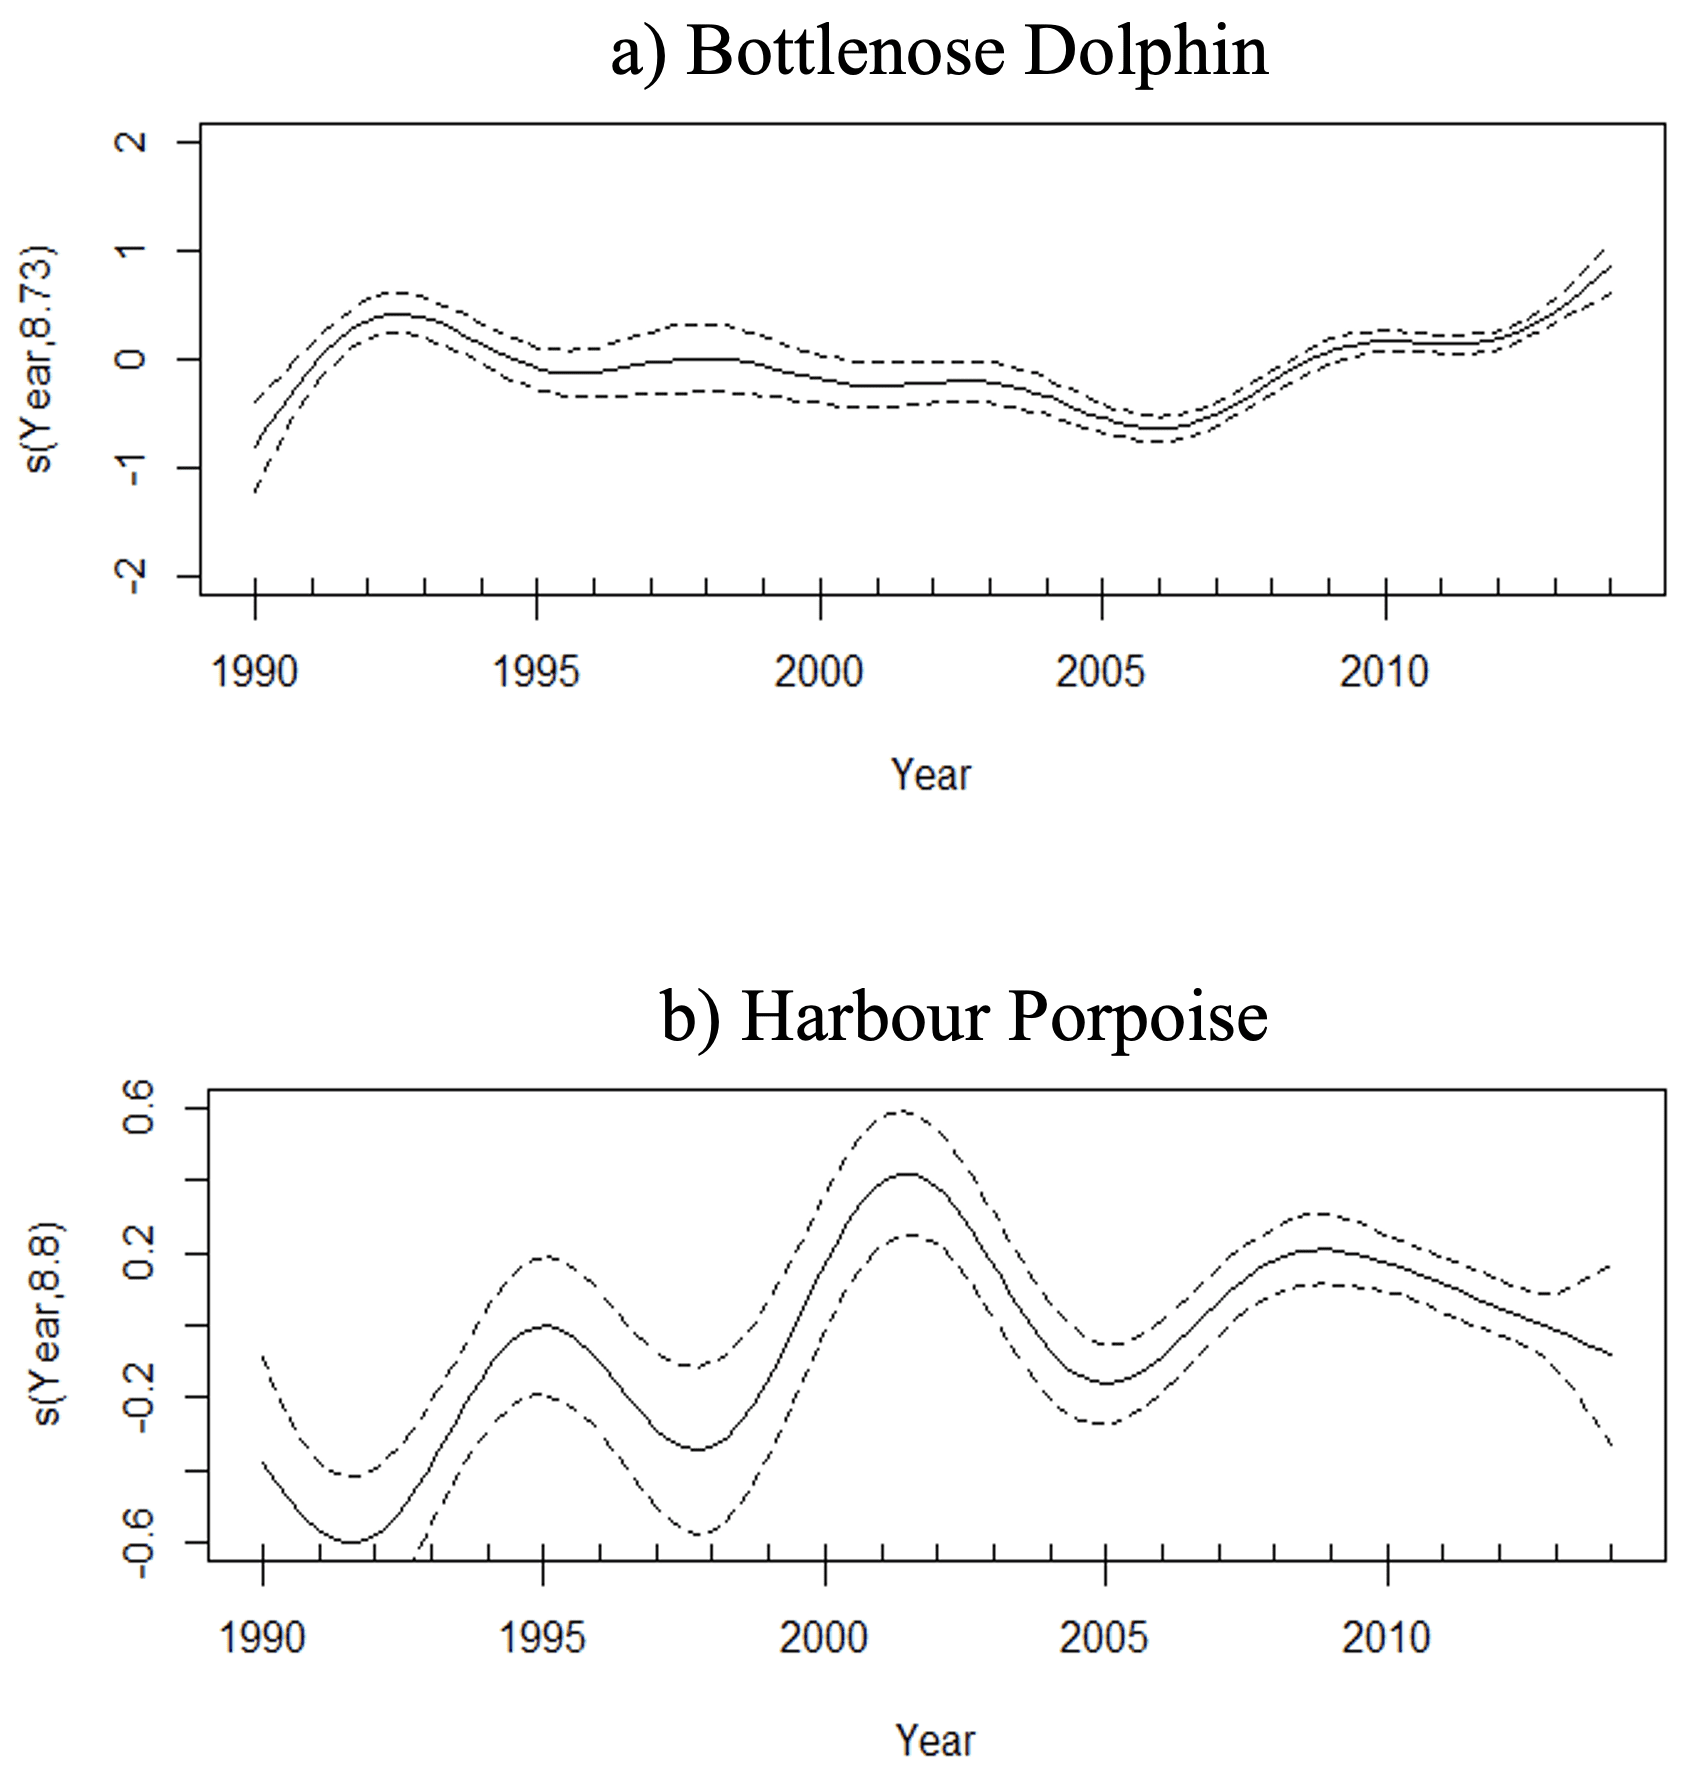
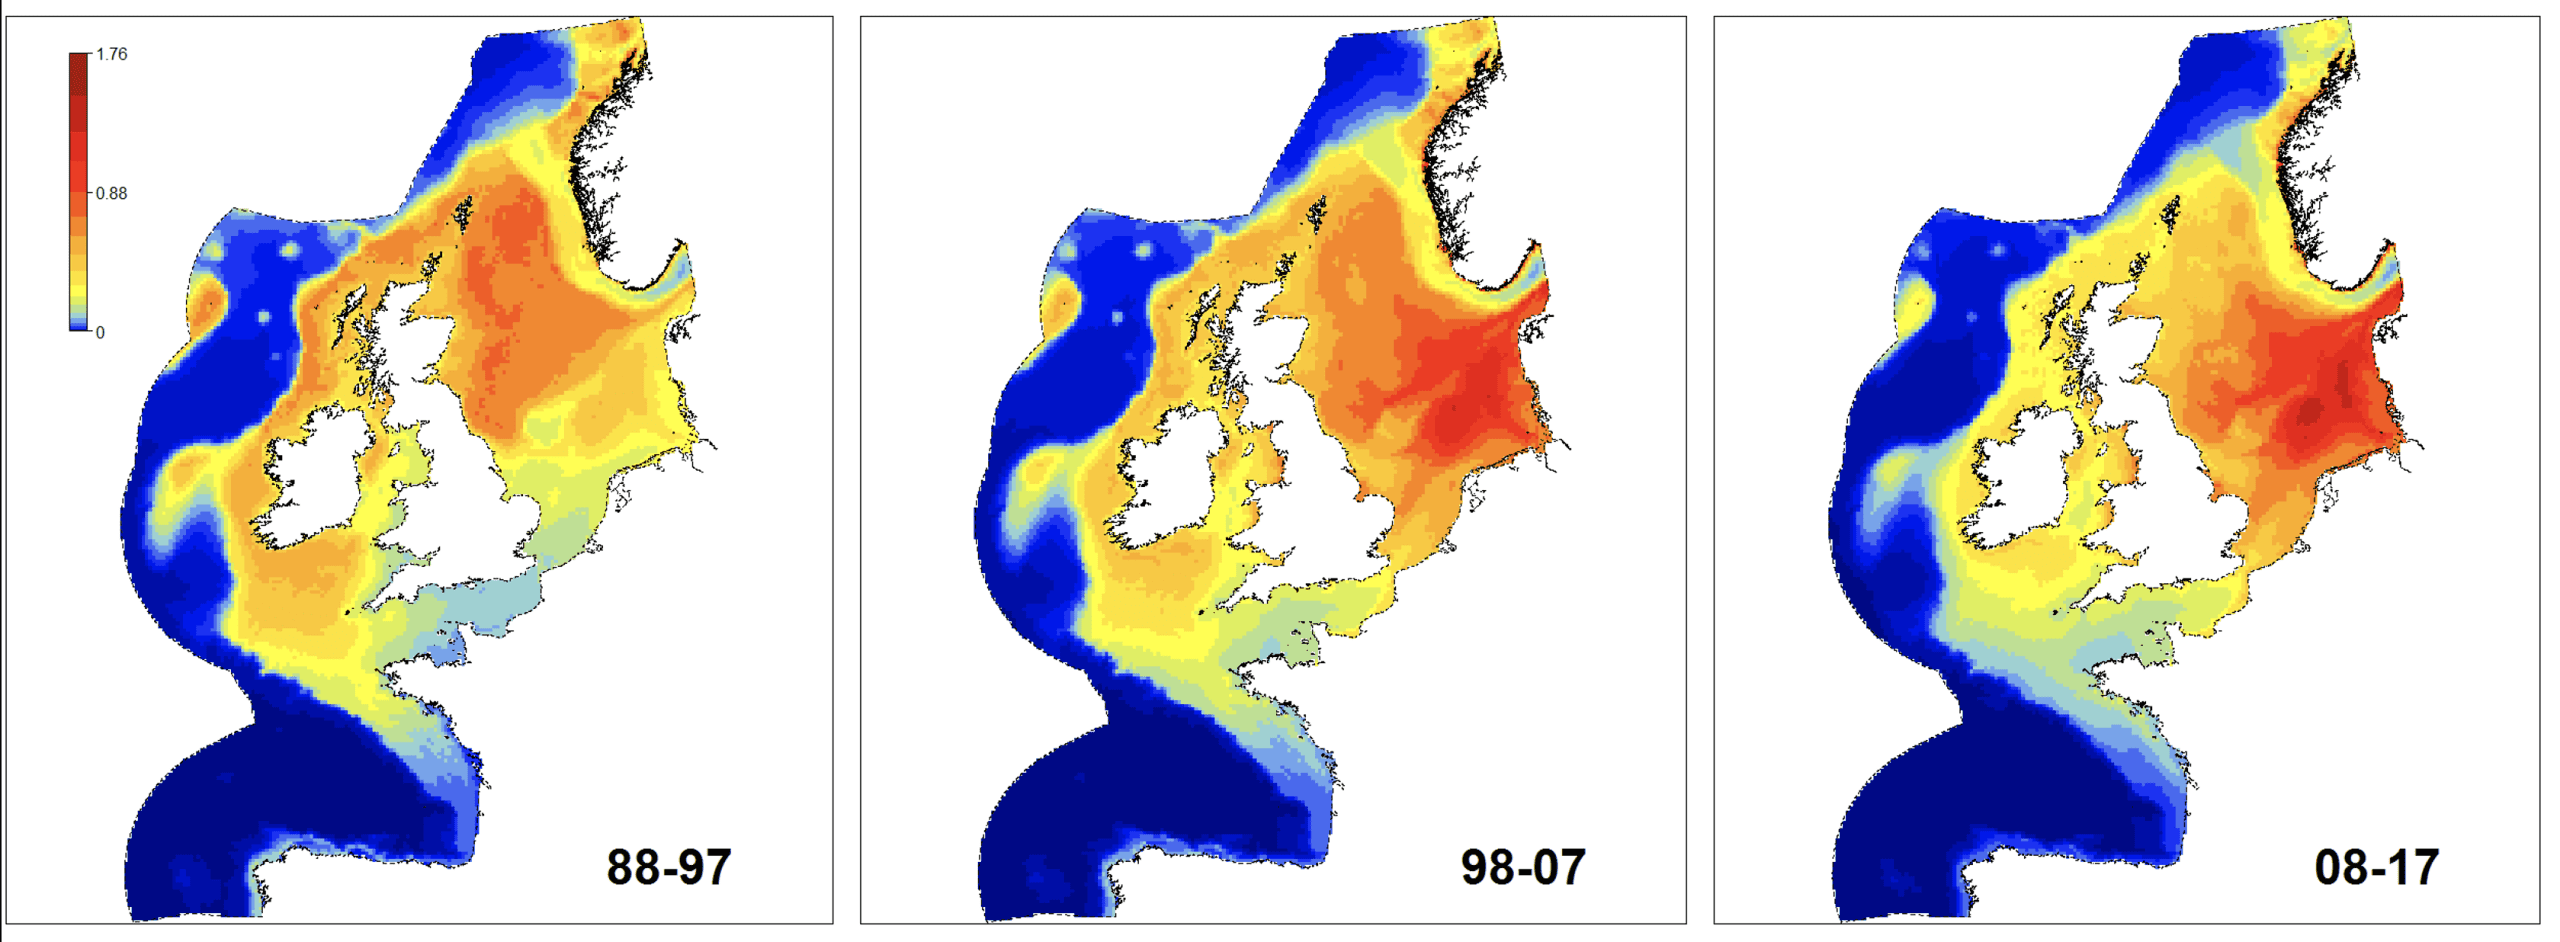
Long-term trends of bottlenose dolphins and harbour porpoise in the UK.
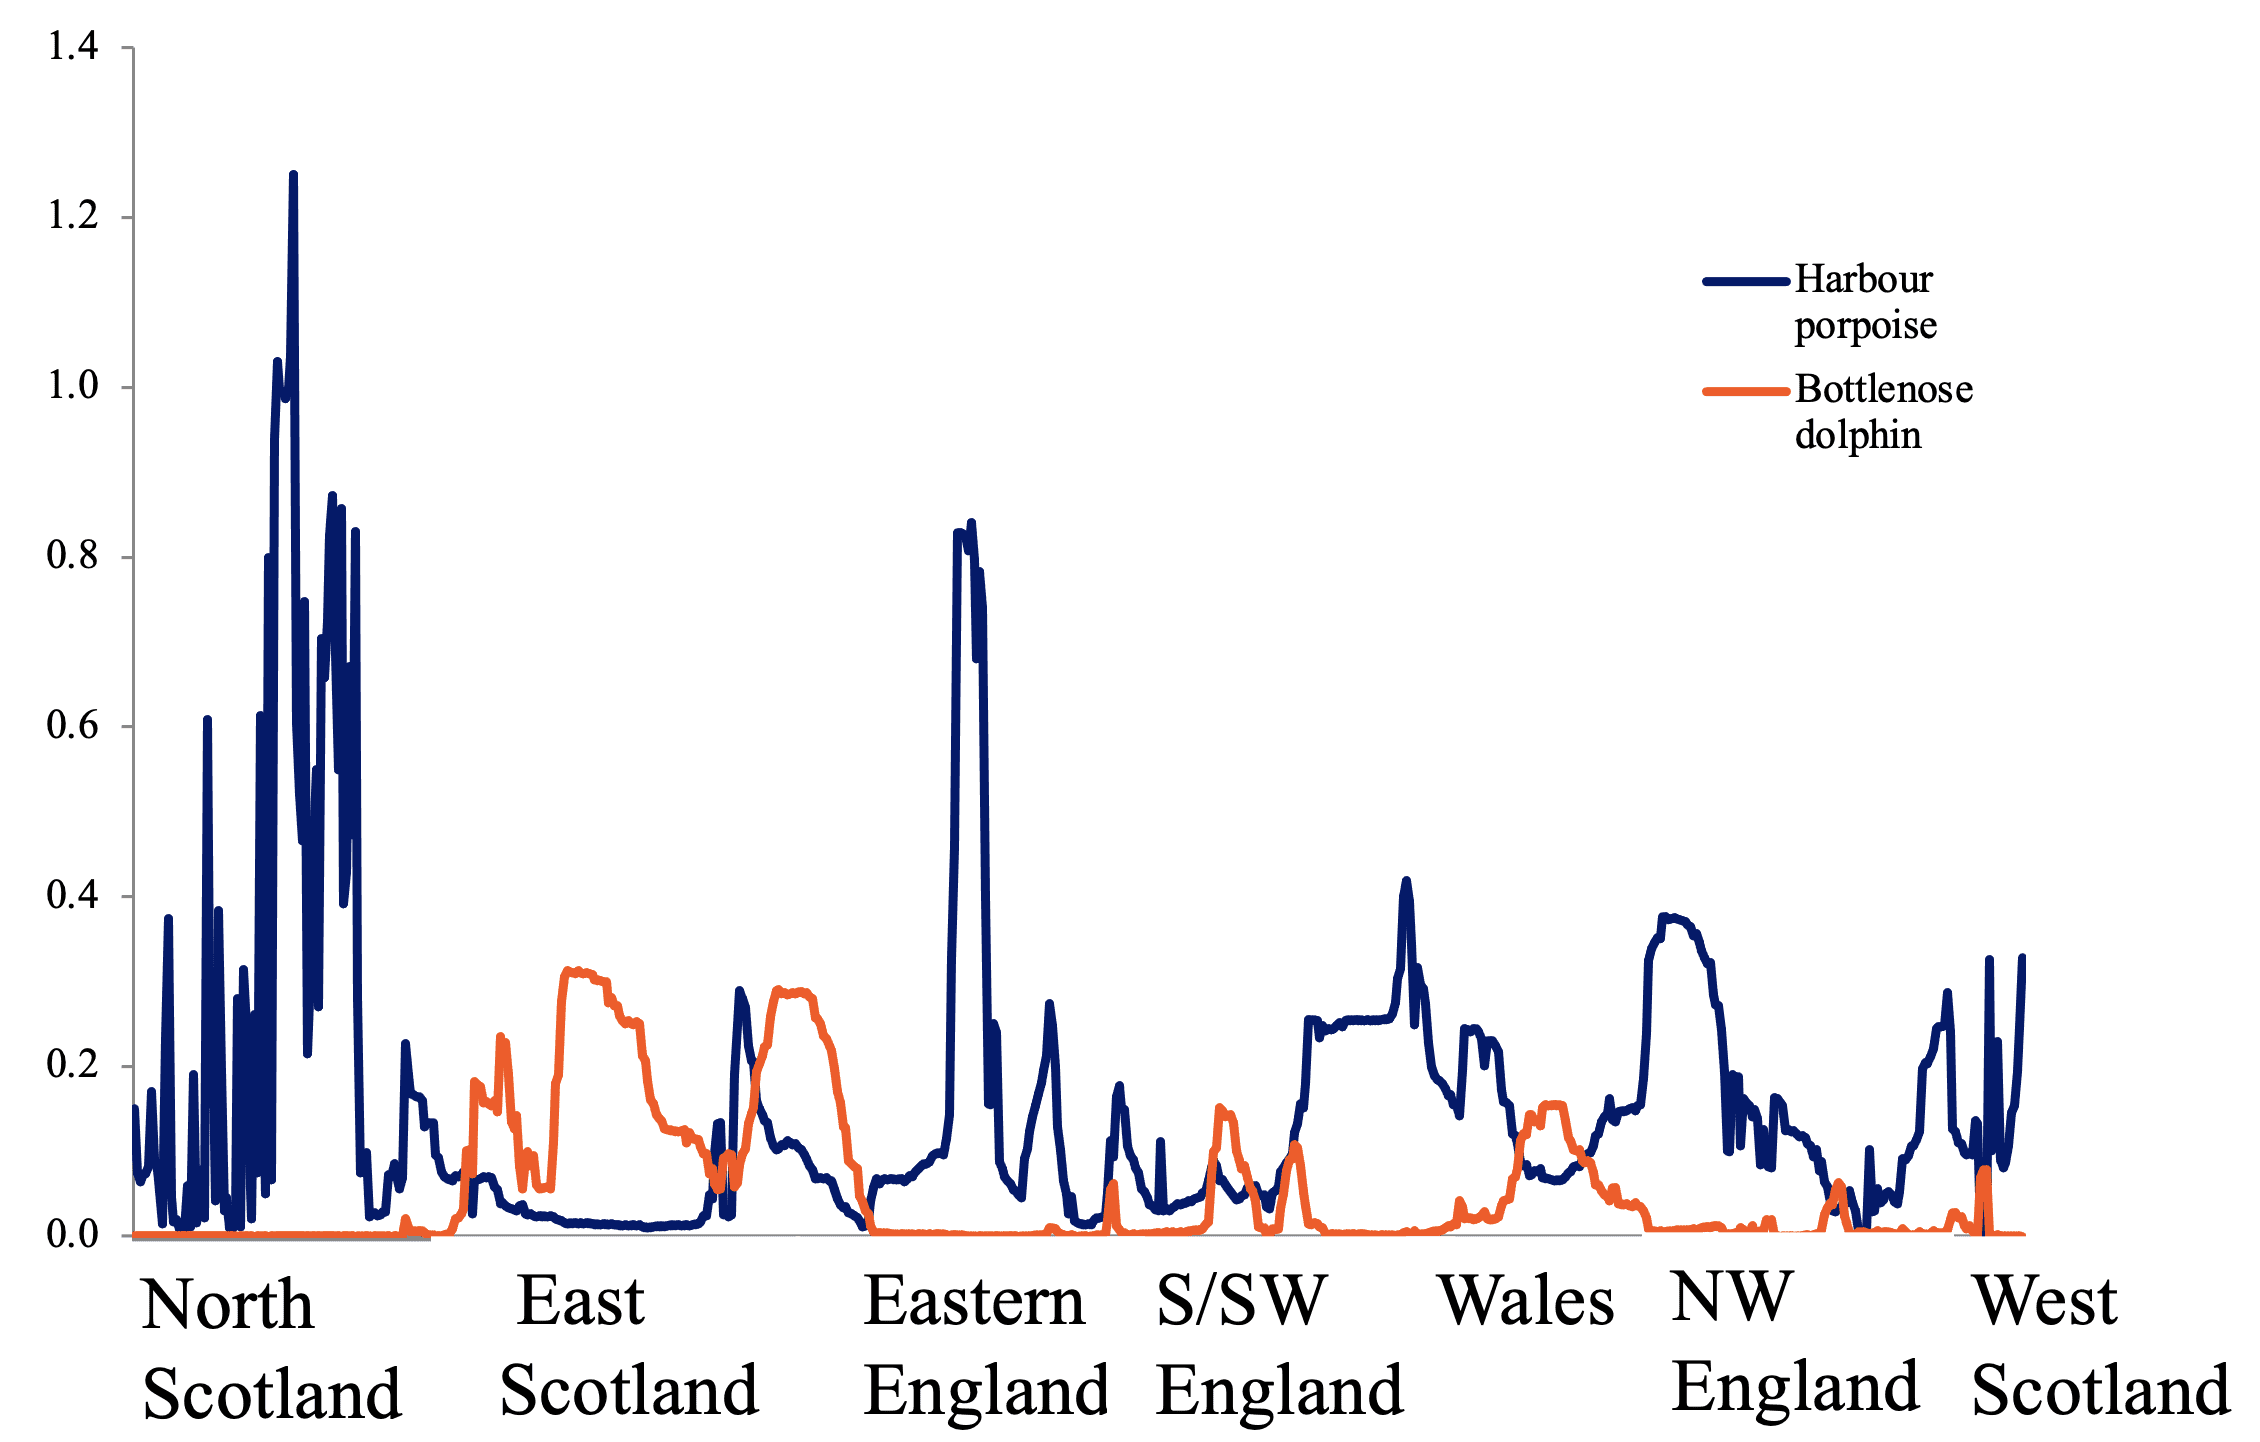
Harbour porpoise vs bottlenose dolphin distribution around the UK.
Land survey vs at-sea survey harbour porpoise encounter rates.
Land survey vs at-sea survey bottlenose dolphin encounter rates.
At-sea surveys
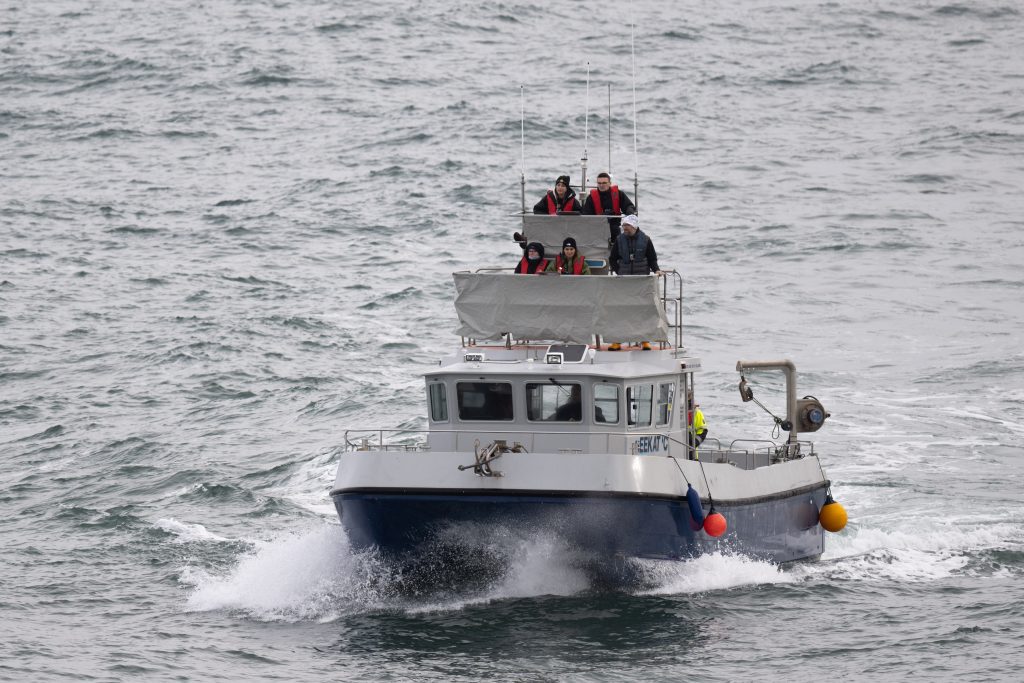
Watching from land gives us a picture of the status of different species in coastal waters, but most species have ranges that extend well beyond the coast, and some only visit coastal waters rarely or in particular seasons. Collecting observations at sea overcomes those limitations, and we encourage everyone who has the opportunity to go to sea to record the track of their vessel and the period during which they are dedicating time to watching for animals. In the same way as for watches from land, it is important to record sea conditions, group size, date, time and location of any sighting.
The SeaWatcher app is free to download and makes it easy to record observations from land or sea. With a range of identification tools, it helps users log sightings effortlessly
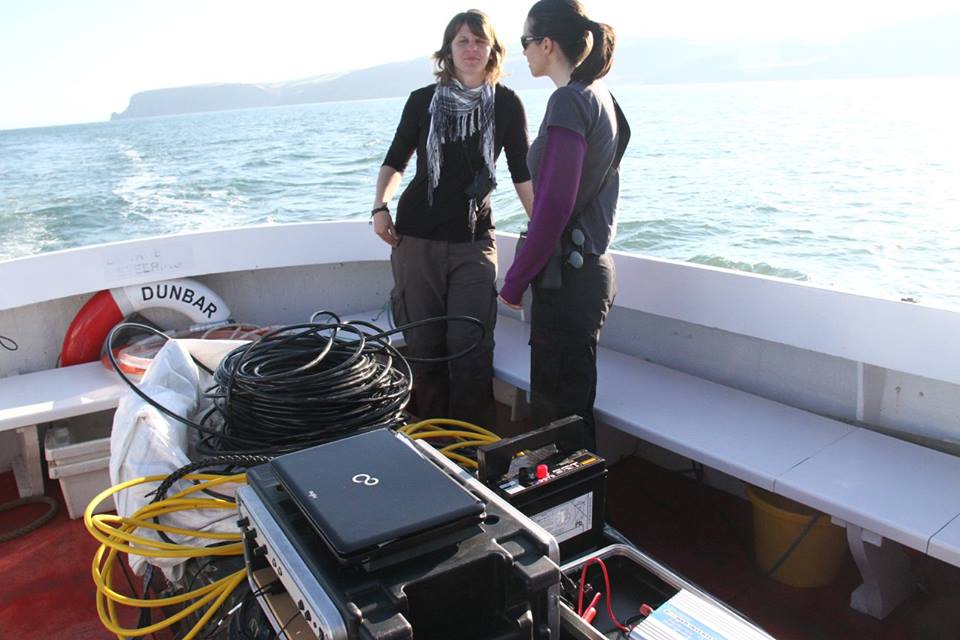
Towed hydrophone set-up.
Photo credit: K Lohrengel/Sea Watch Foundation
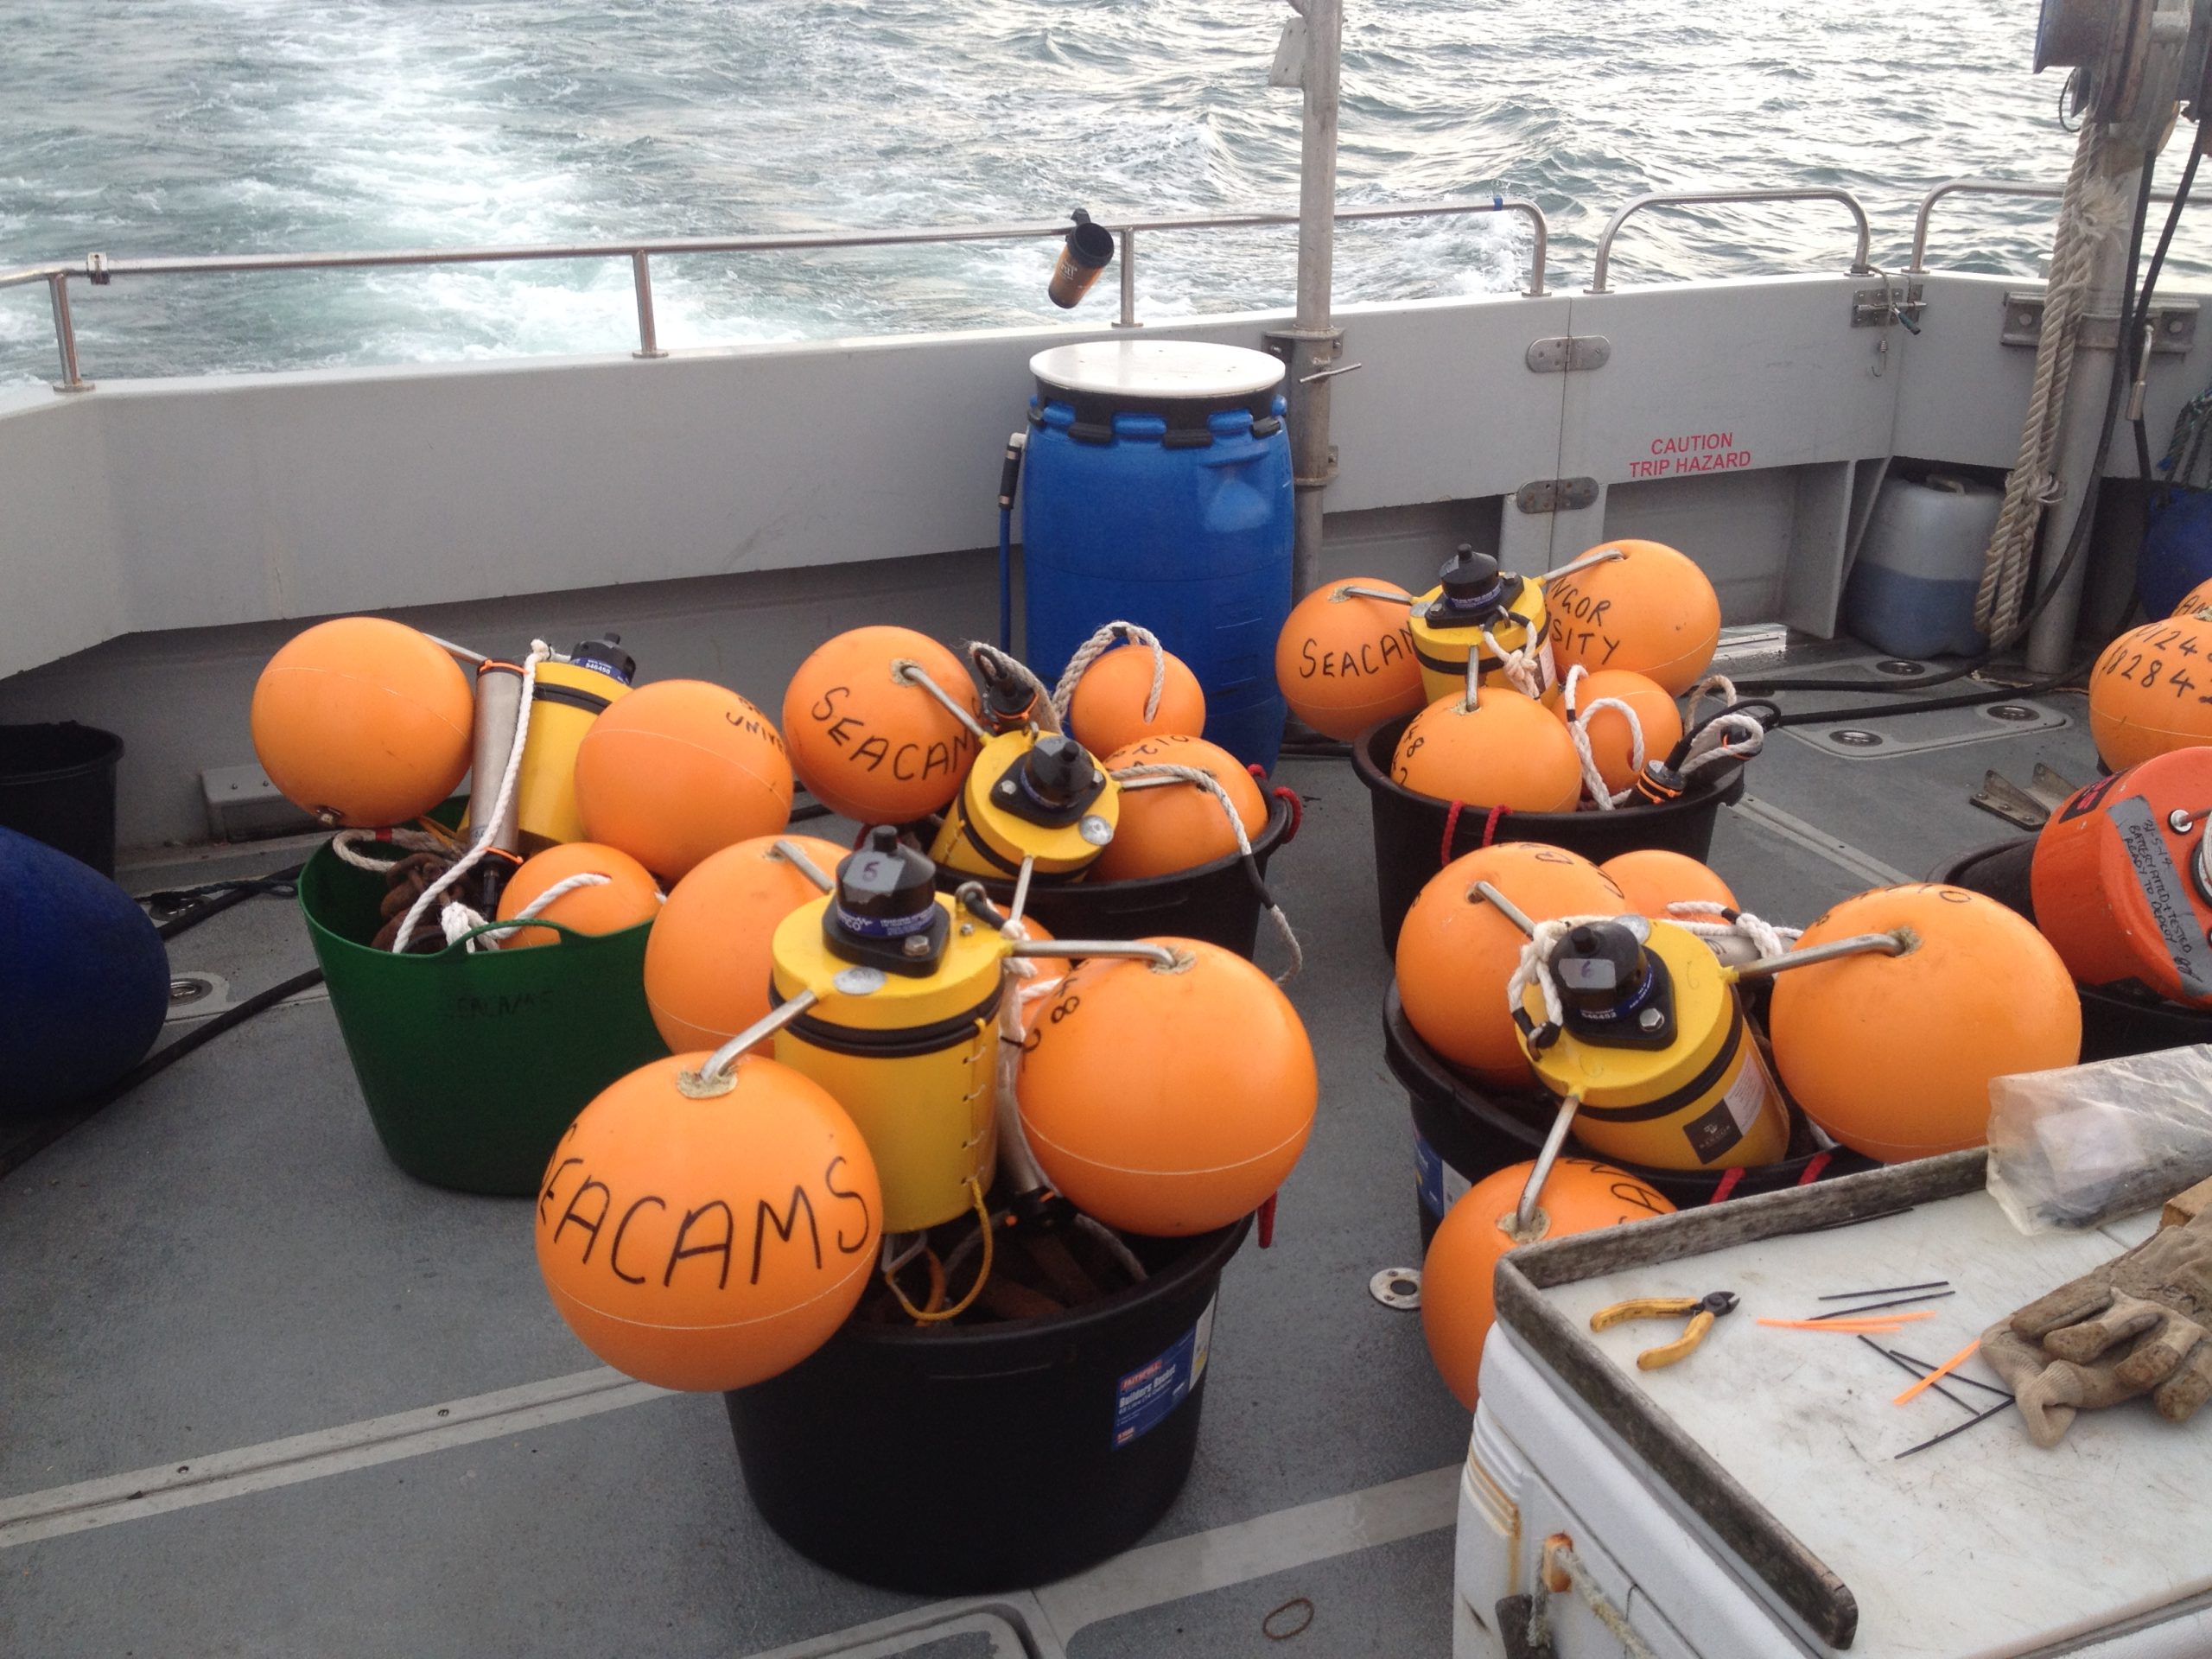
Sound trap PAM set-up.
Photo credit: G Veneruso
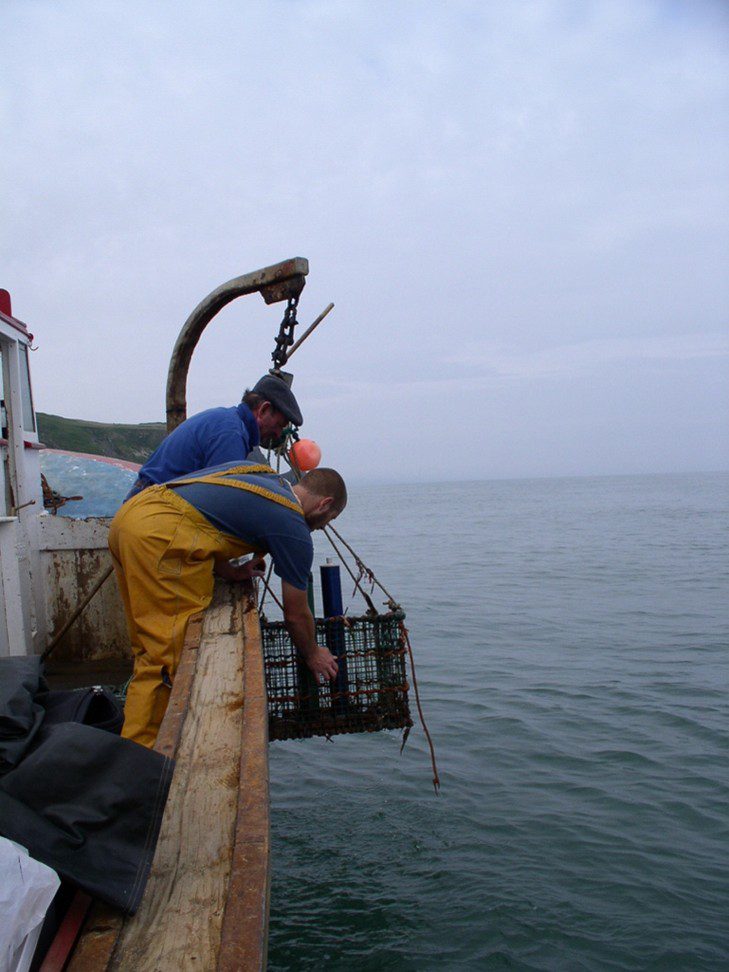
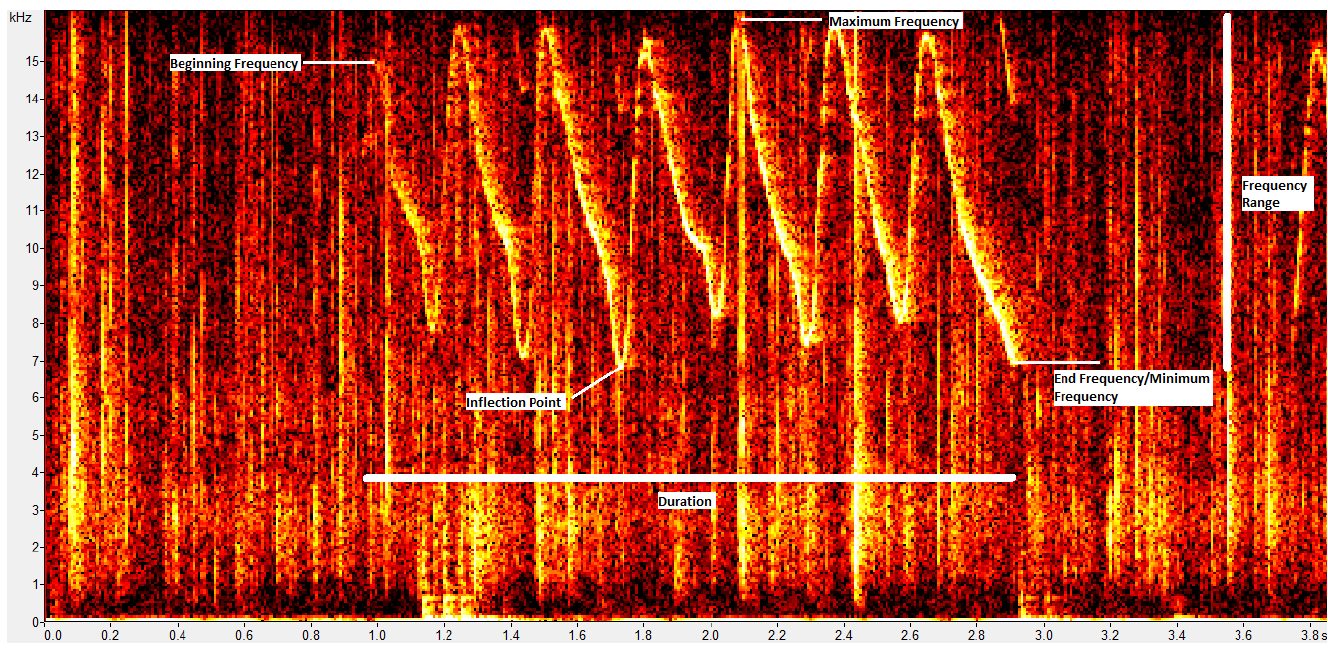
Use of acoustics is another important method of monitoring cetaceans at sea. They have the potential to provide information 24-hours of the day, every day of the year and in all weathers. This can be done either by towing a hydrophone behind the vessel to cover a wide area, or by deploying a static device such as a C-POD (or its latest equivalent, the F-POD) or a Sound Trap. Of course, they rely upon the animals making a sound. In the case of a towed hydrophone, the sounds may be dolphin pure tone whistles, dolphin or porpoise echolocation clicks, or baleen whale low frequency moans, trumpet or knocking sounds. C-PODs were deployed in Cardigan Bay Special Area of Conservation to monitor the presence of bottlenose dolphins and porpoises in different habitats, whereas towed hydrophones were used in deeper waters to survey common dolphins in the Celtic Deep, and Risso’s dolphins in the Hebrides. Dipping a hydrophone in the water has also provided valuable information on whistle characteristics in different bottlenose dolphin populations.
Deploying a C-POD in Cardigan Bay Special Area of Conservation.
Bottlenose dolphin sound spectrogram.
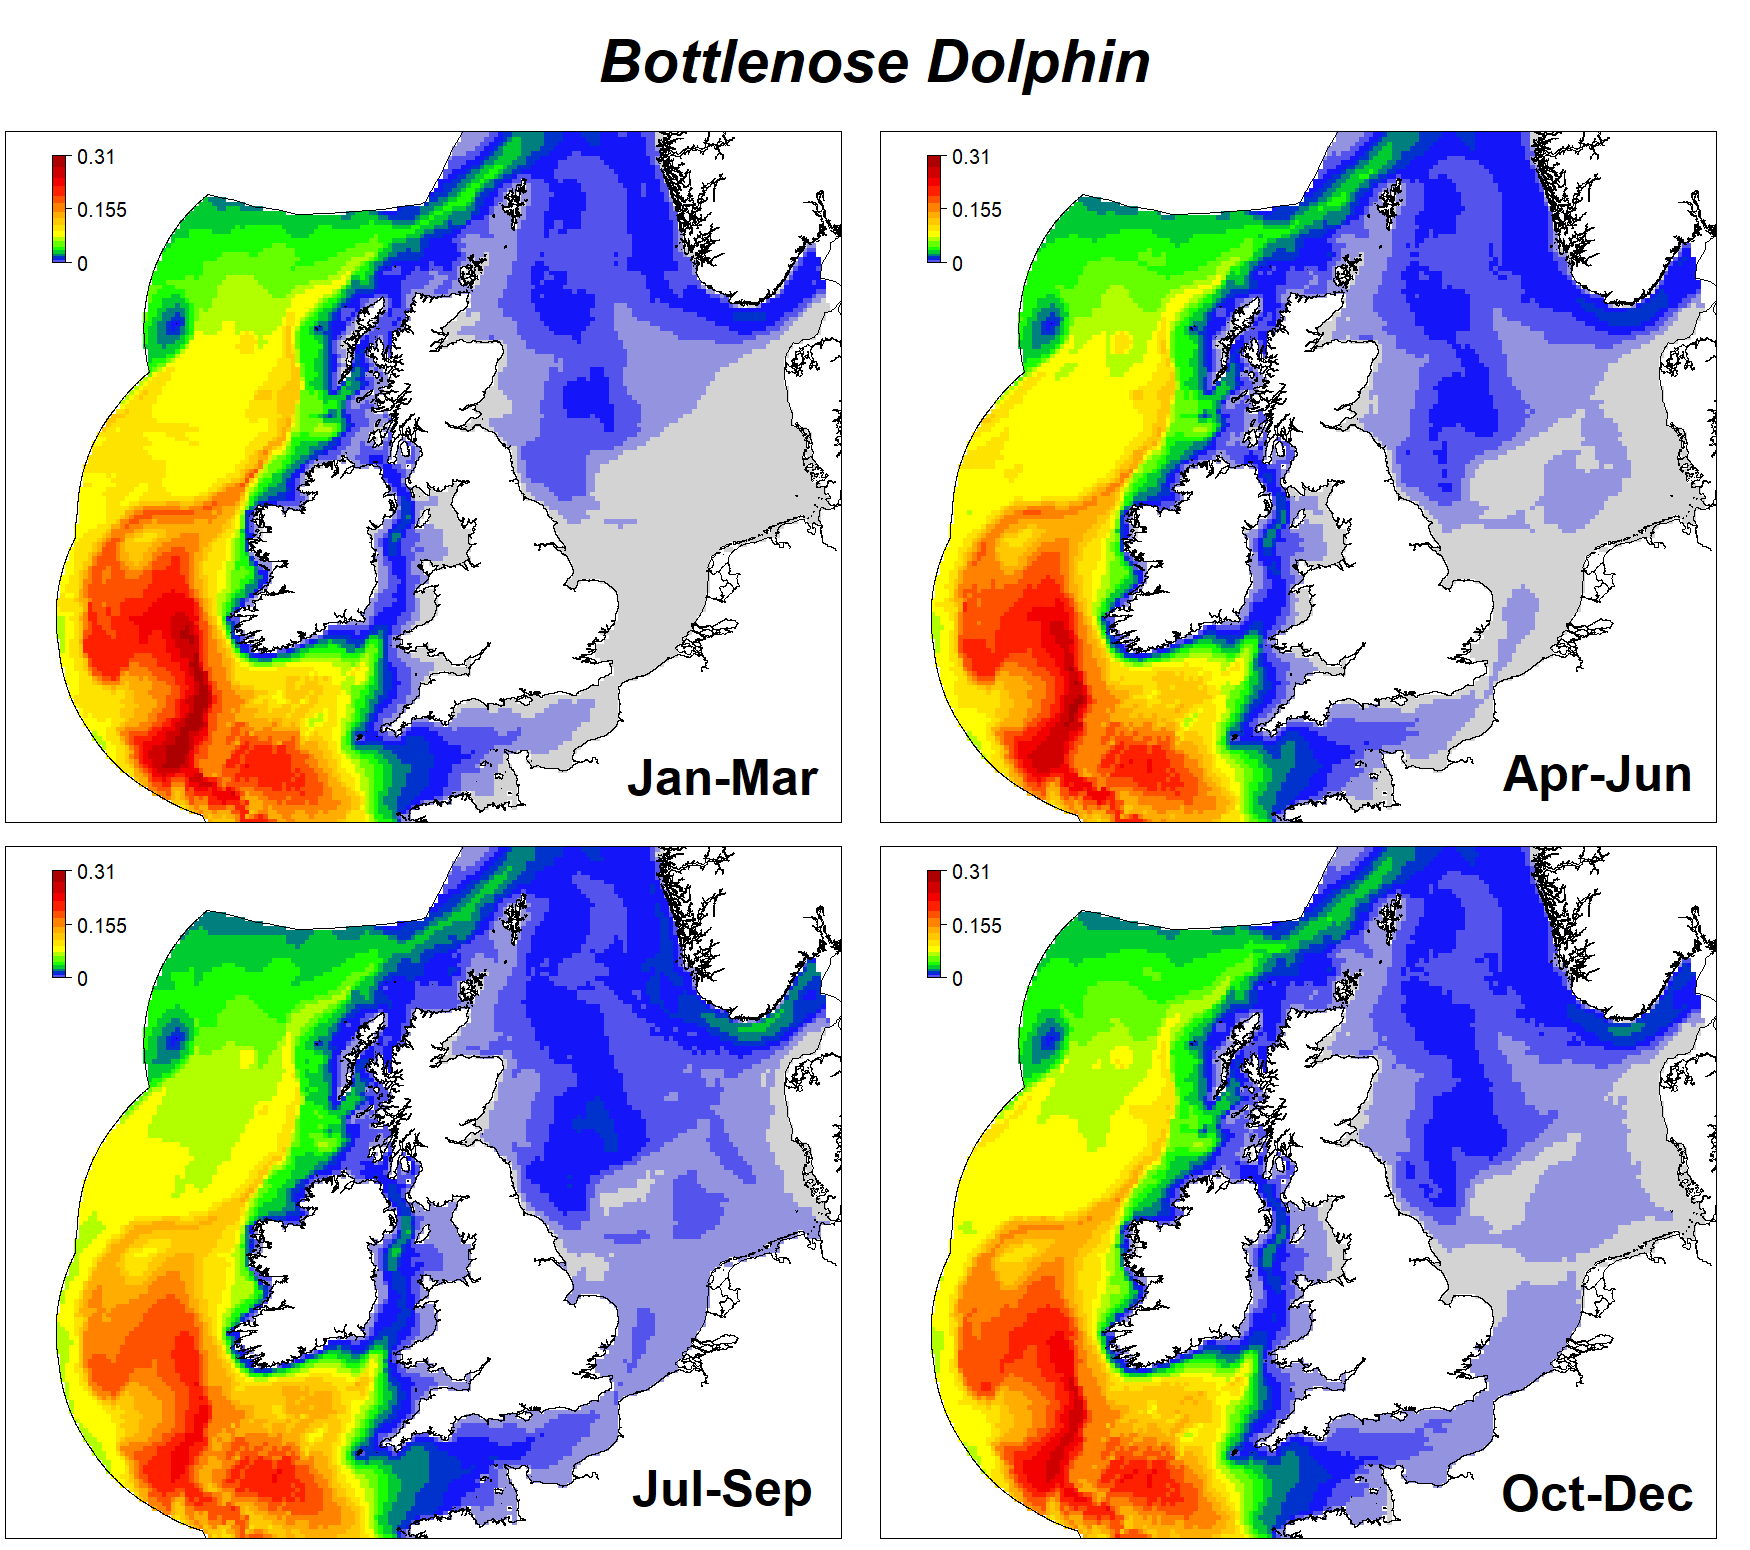
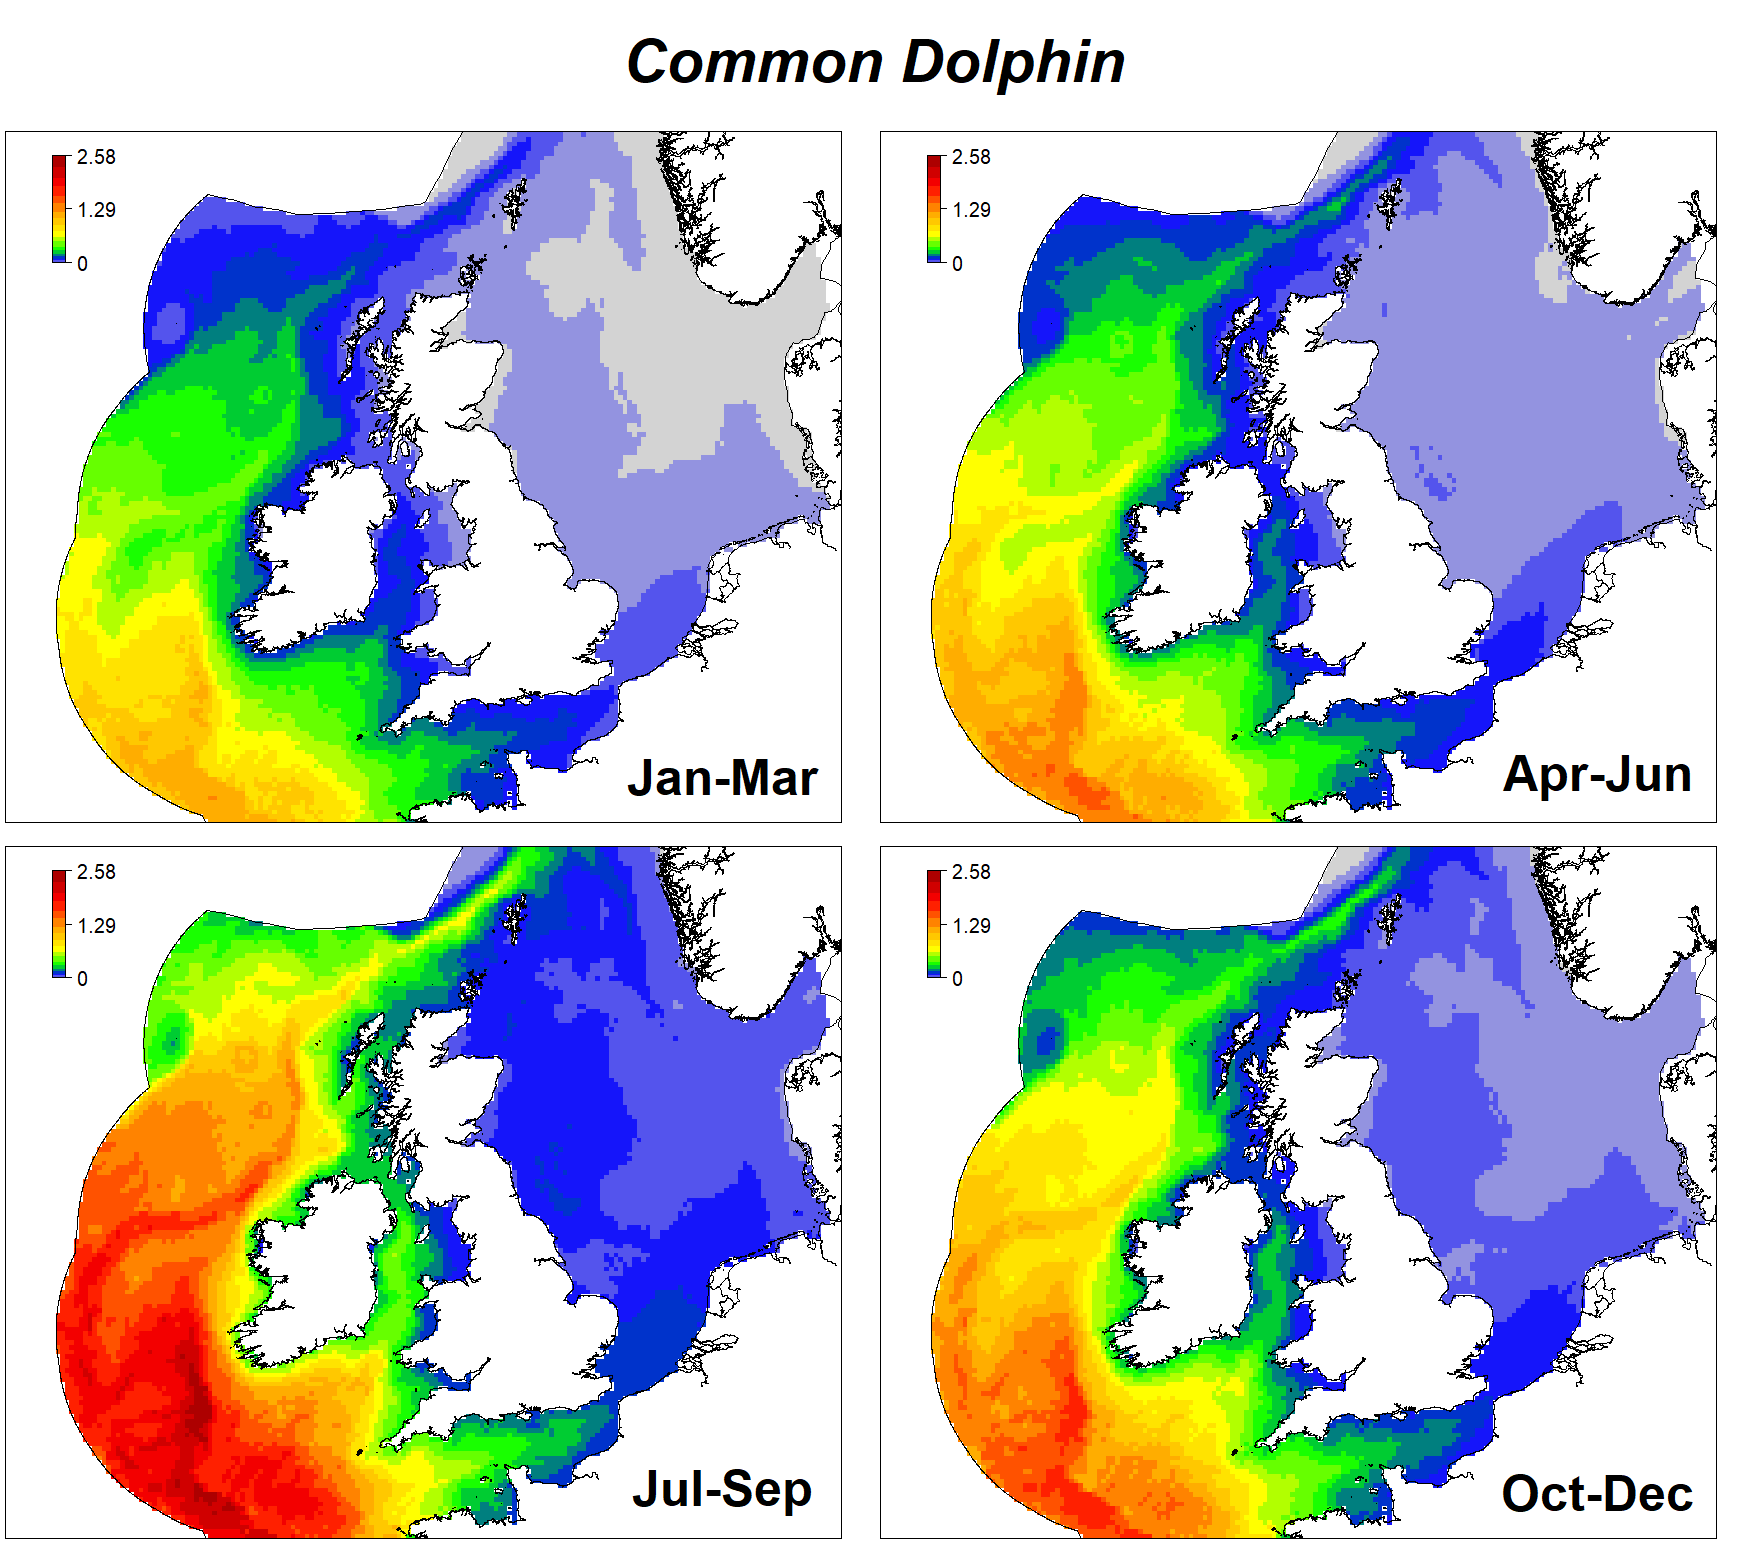
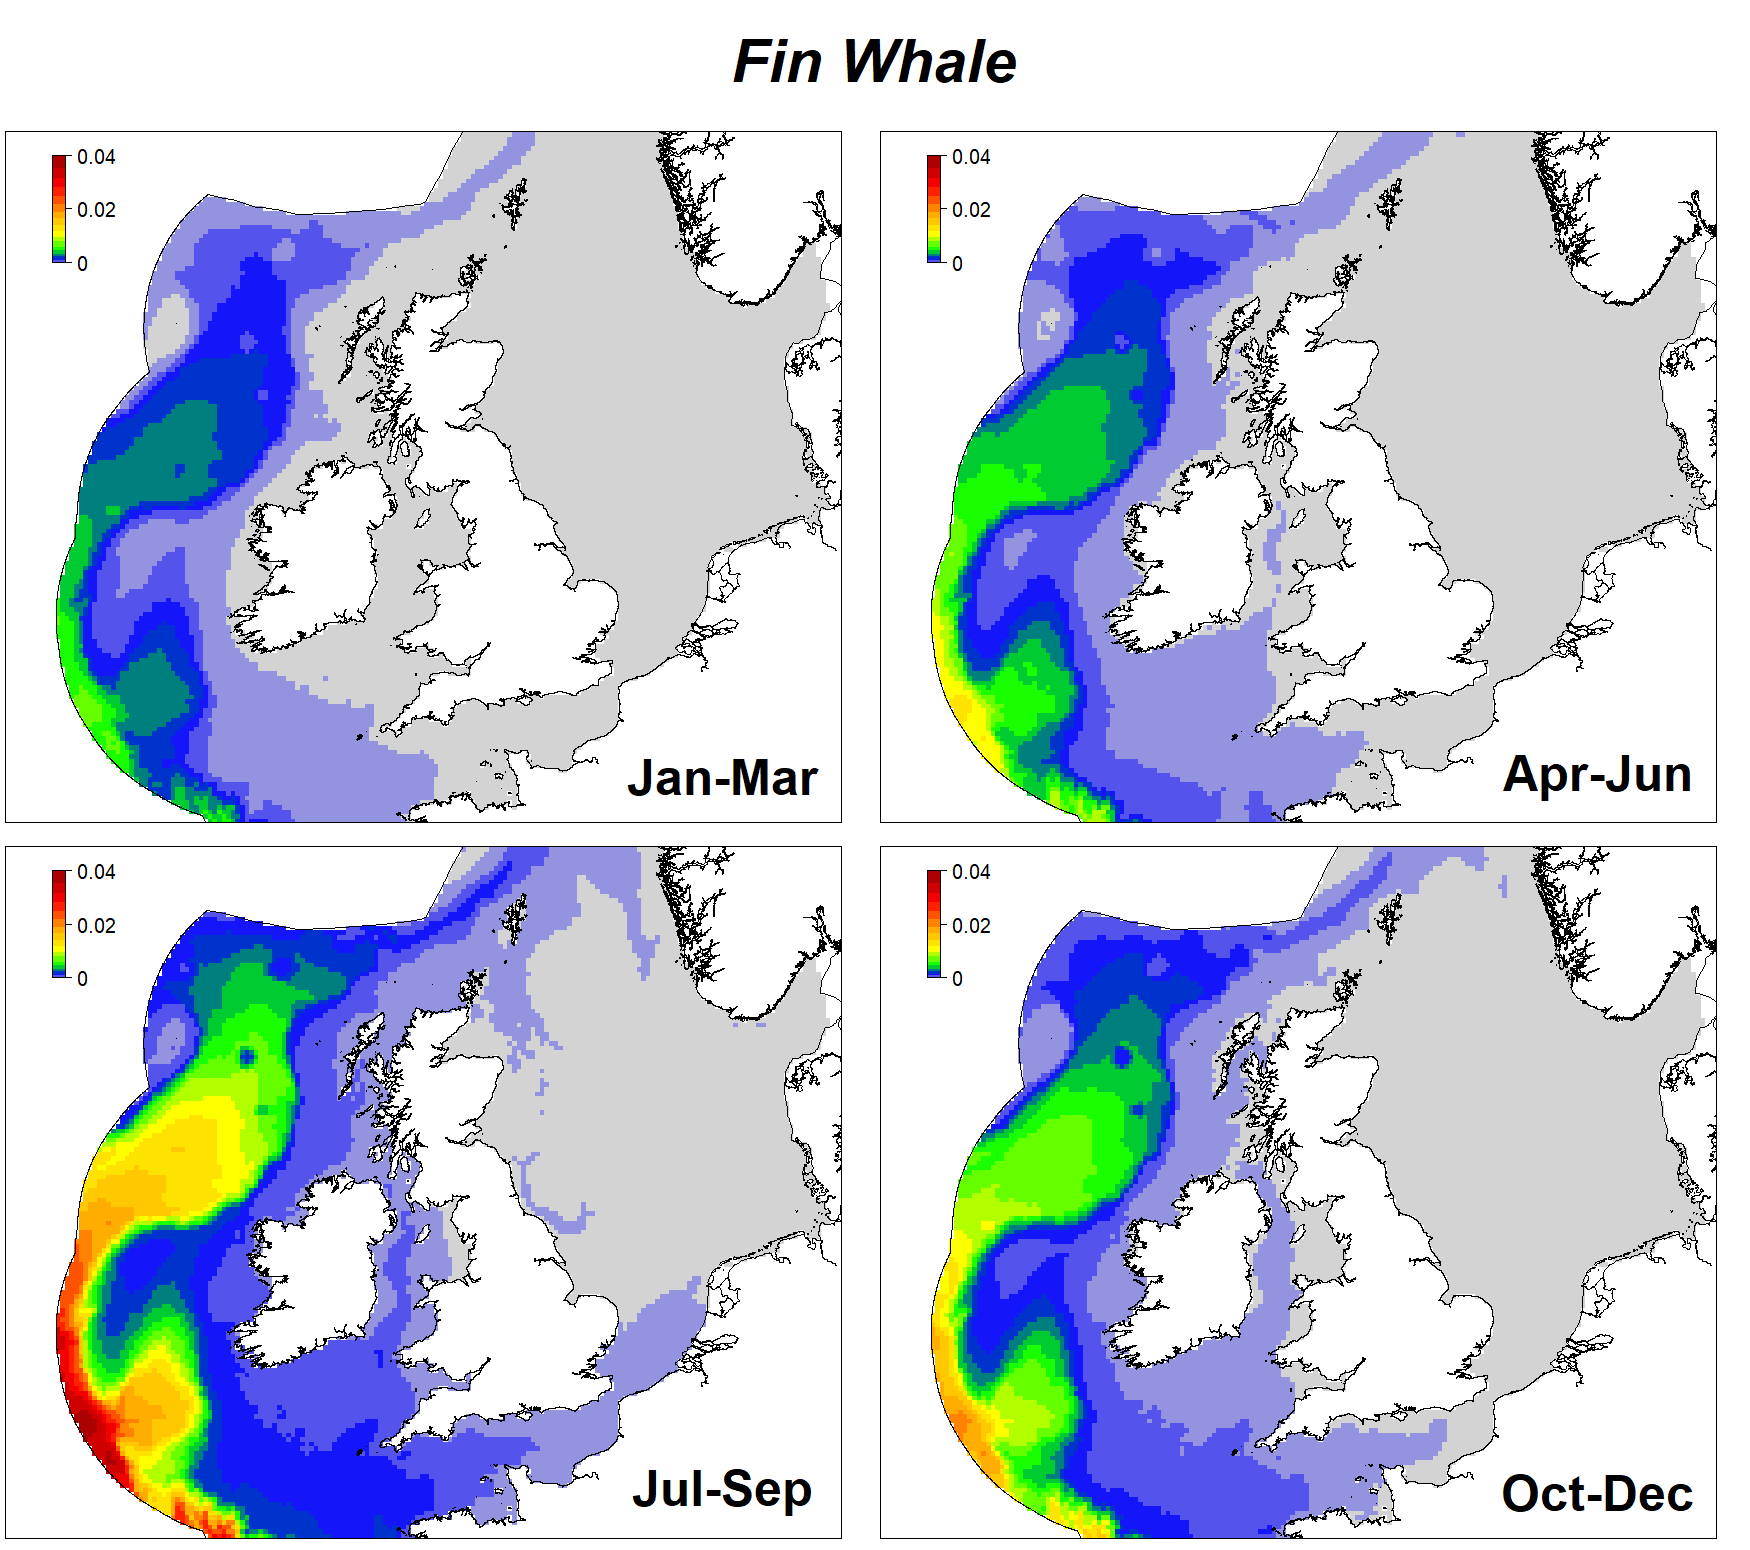
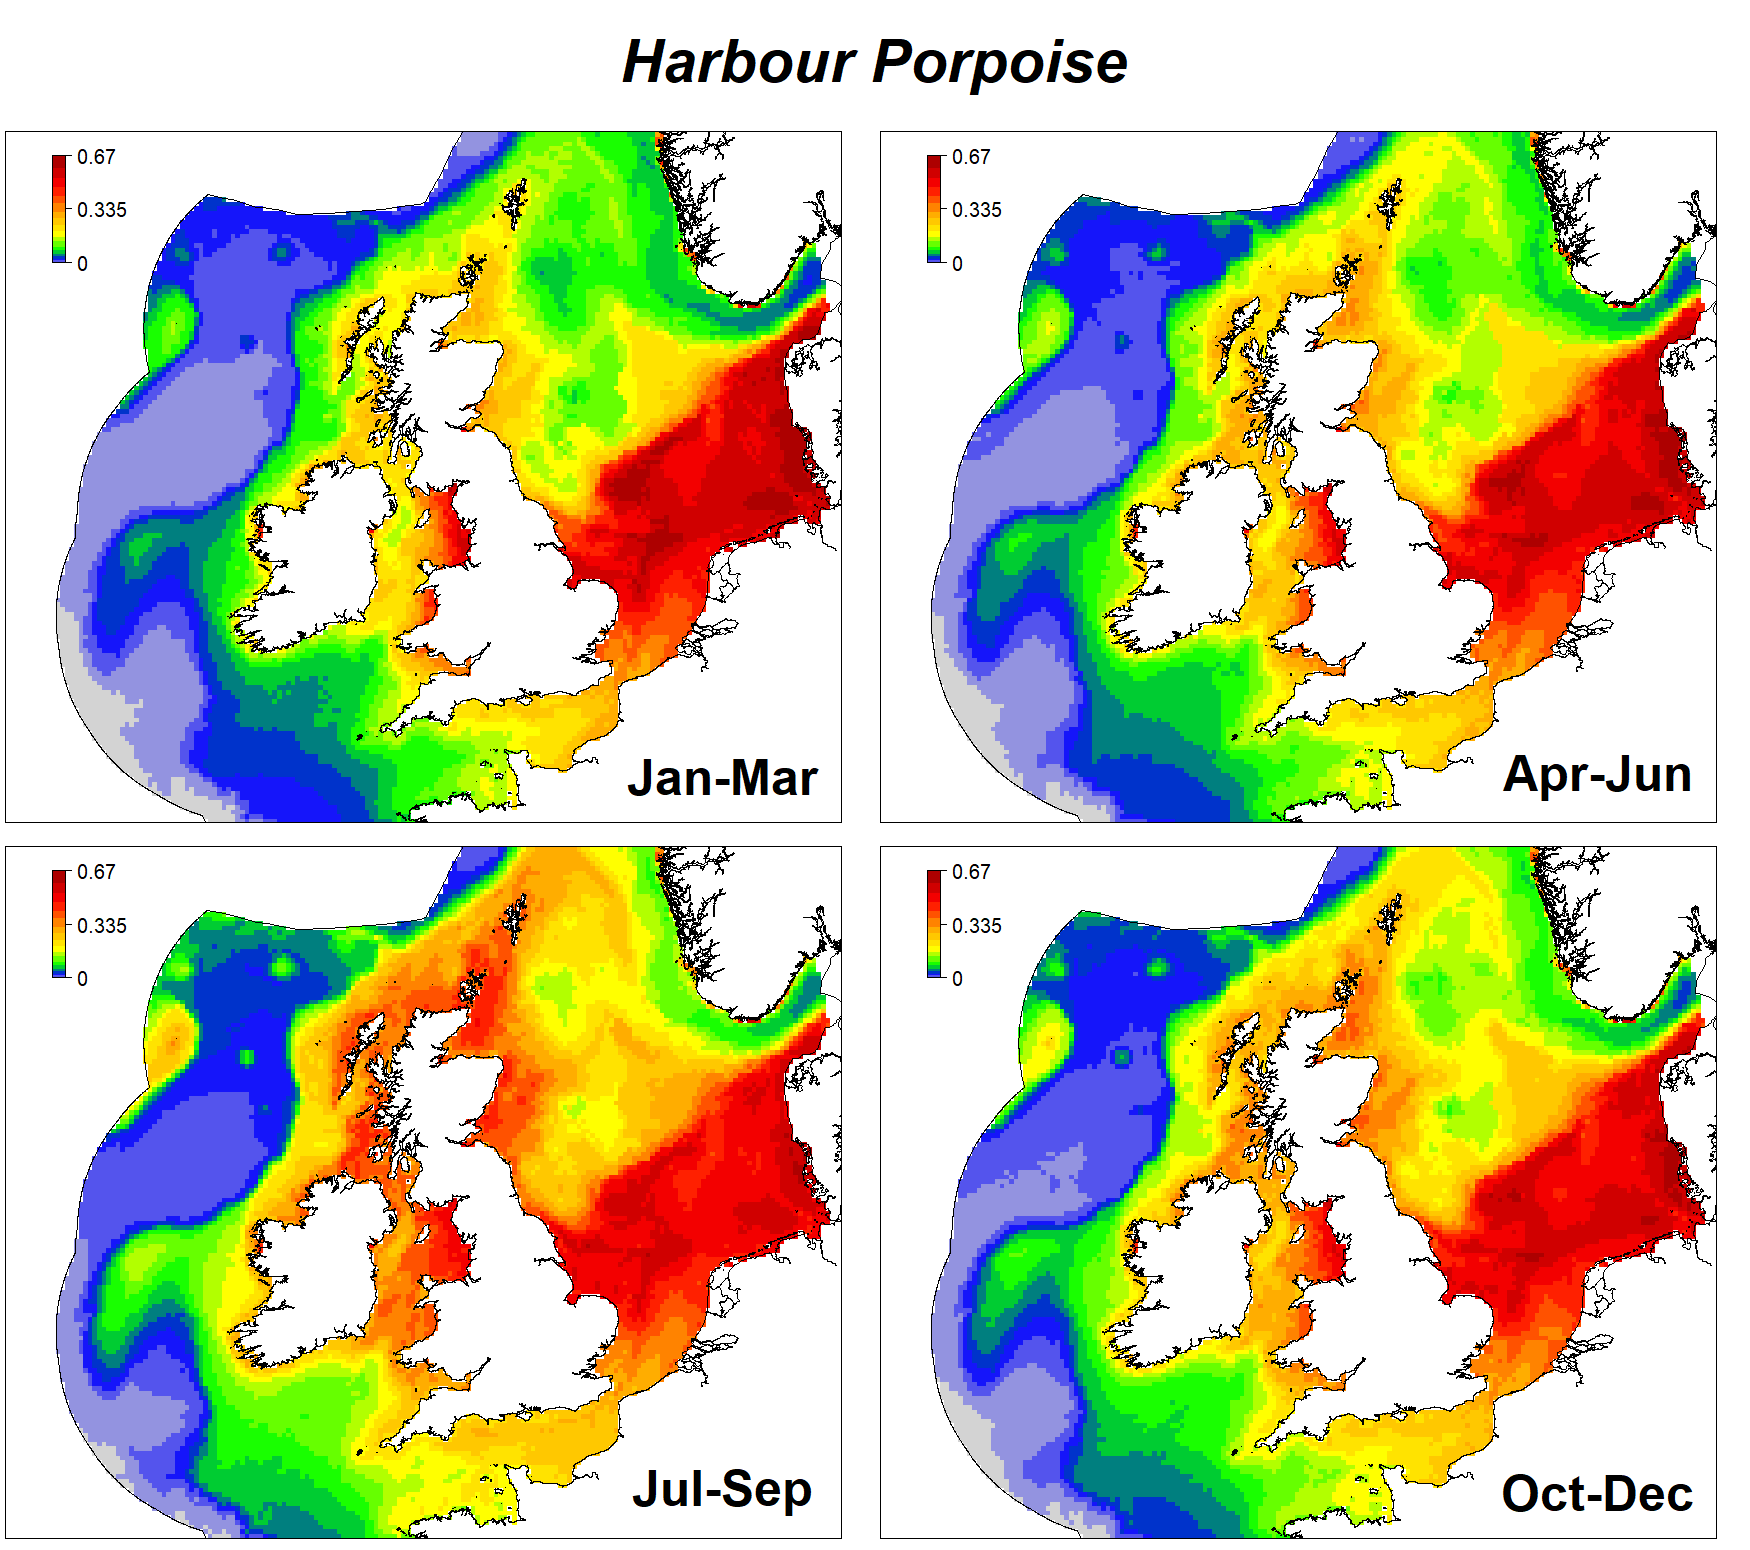
Species distribution maps
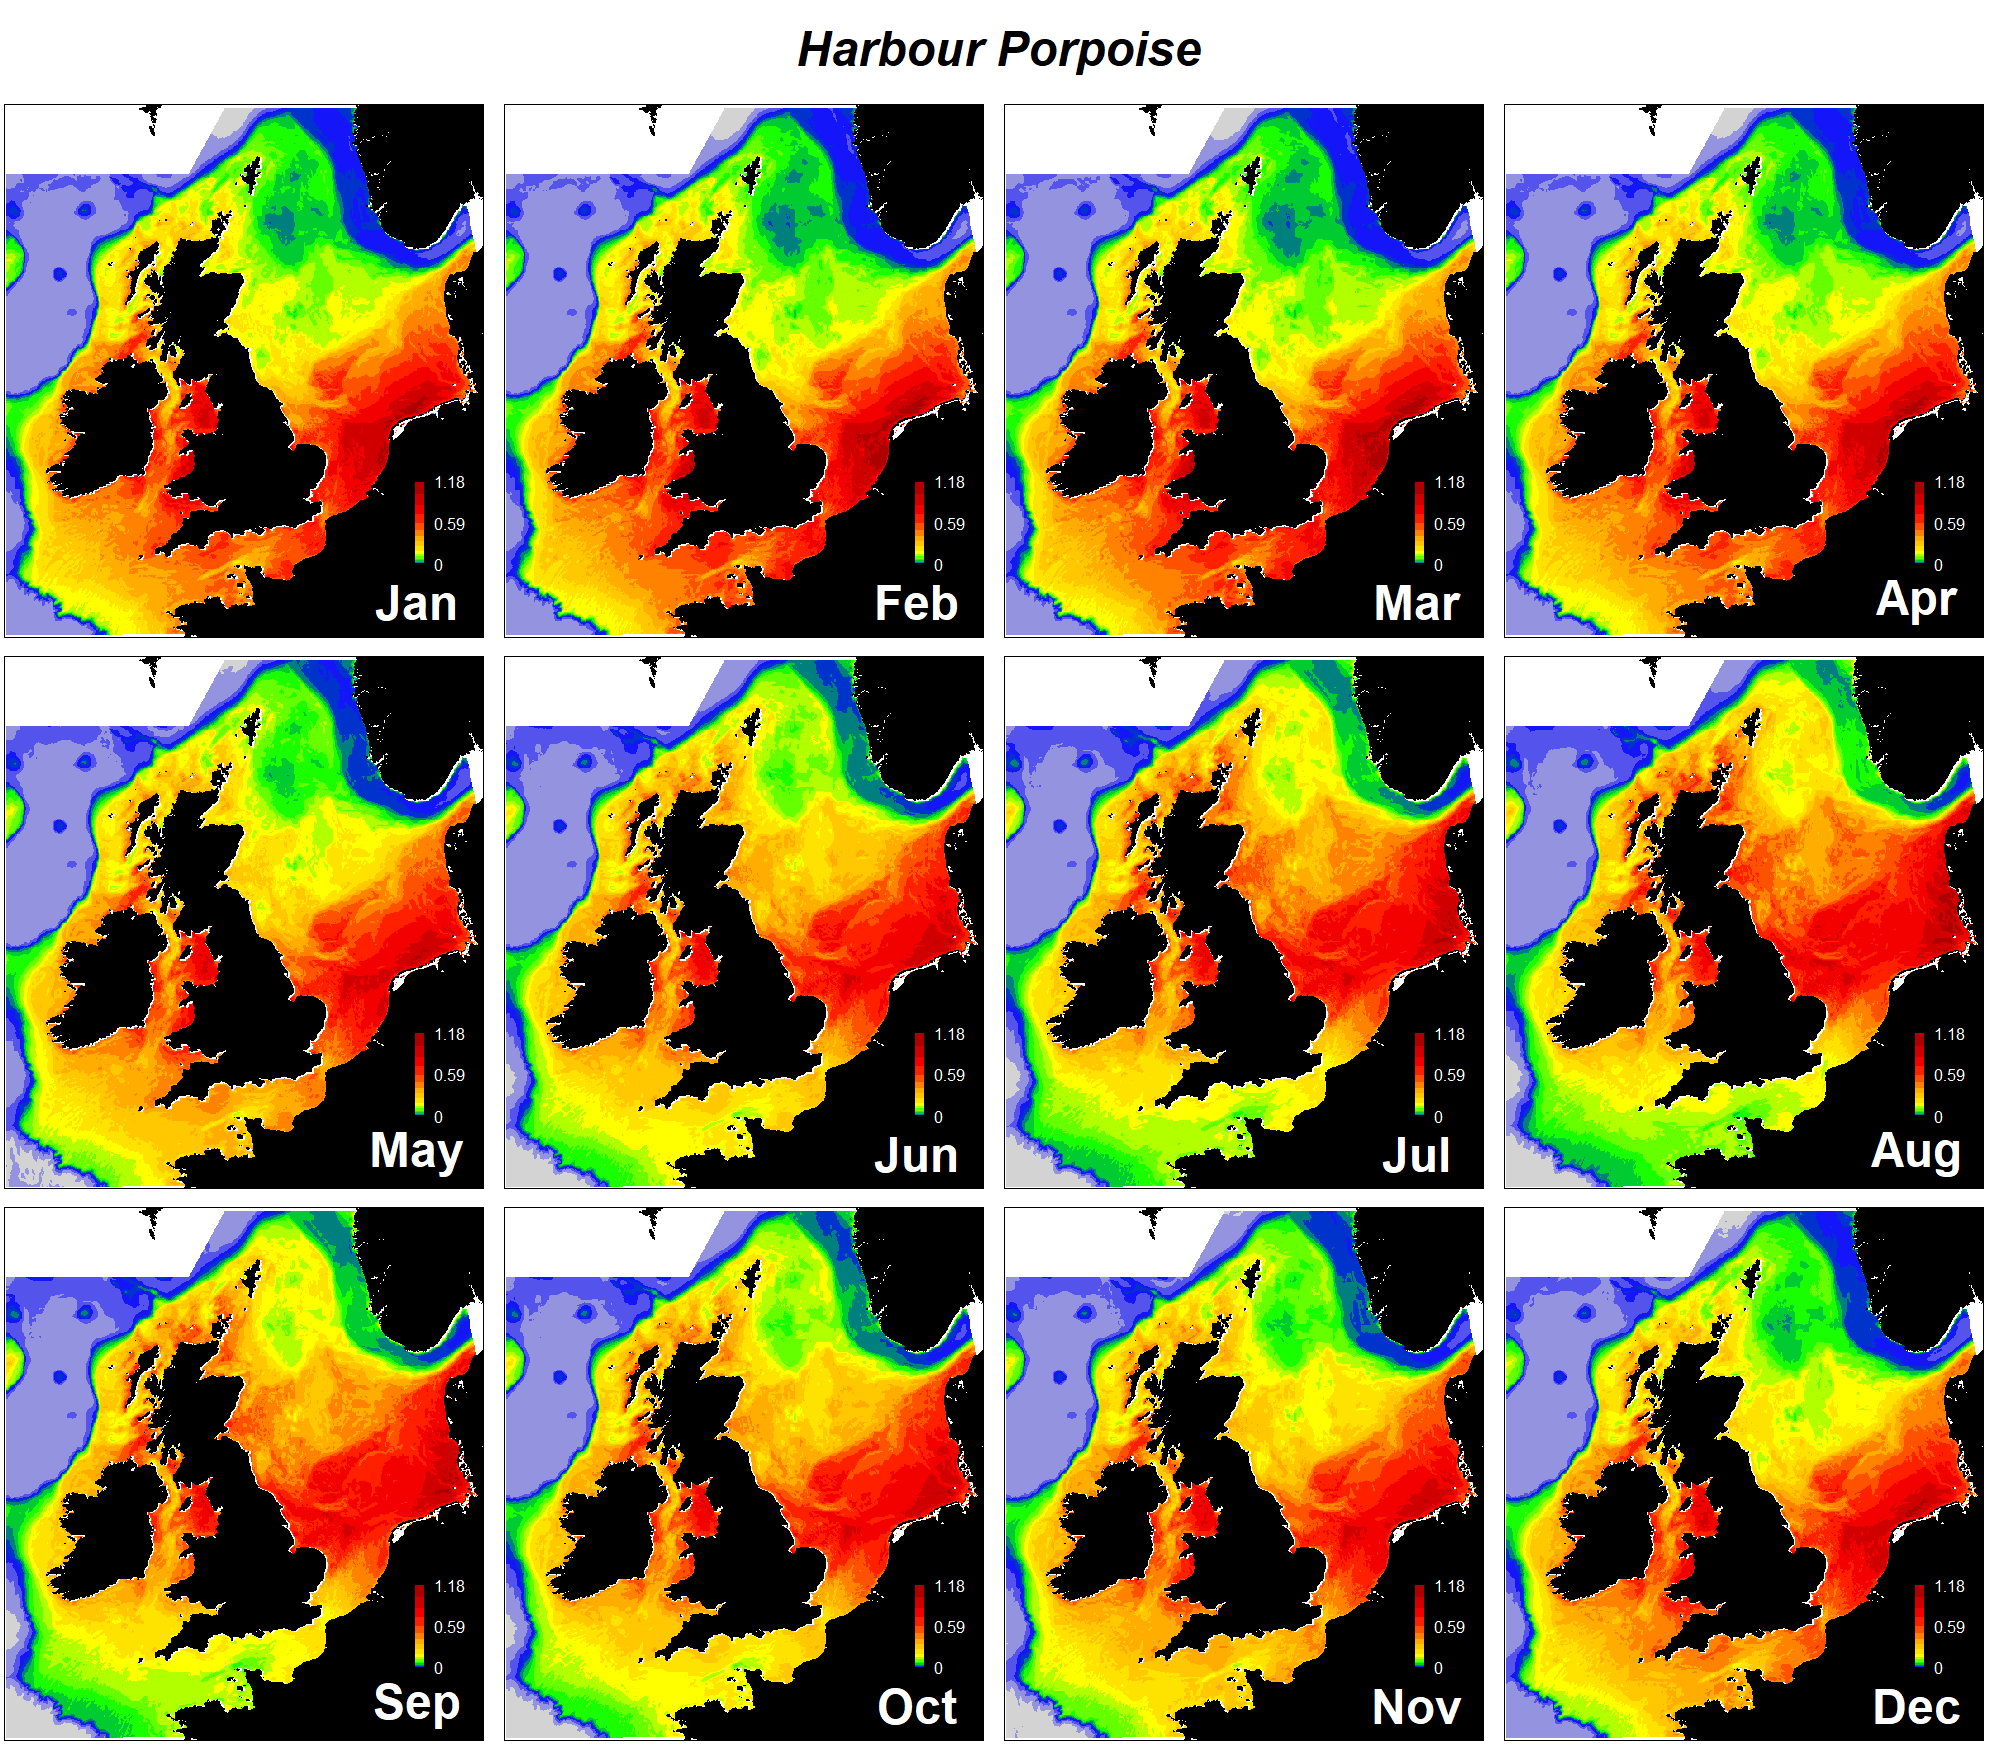
Between 2014 and 2018, as part of the NERC/Defra funded Marine Ecosystem Research Programme (MERP), maps were produced collating all the major surveys undertaken between 1980 and 2018, depicting monthly density distributions of the twelve species of cetaceans regularly occurring around the British Isles, extending over Atlantic Europe from southern Scandinavia to the Iberian Peninsula. These maps were published by Waggitt et al. (2020) in the Journal of Applied Ecology and this paper can be downloaded HERE.
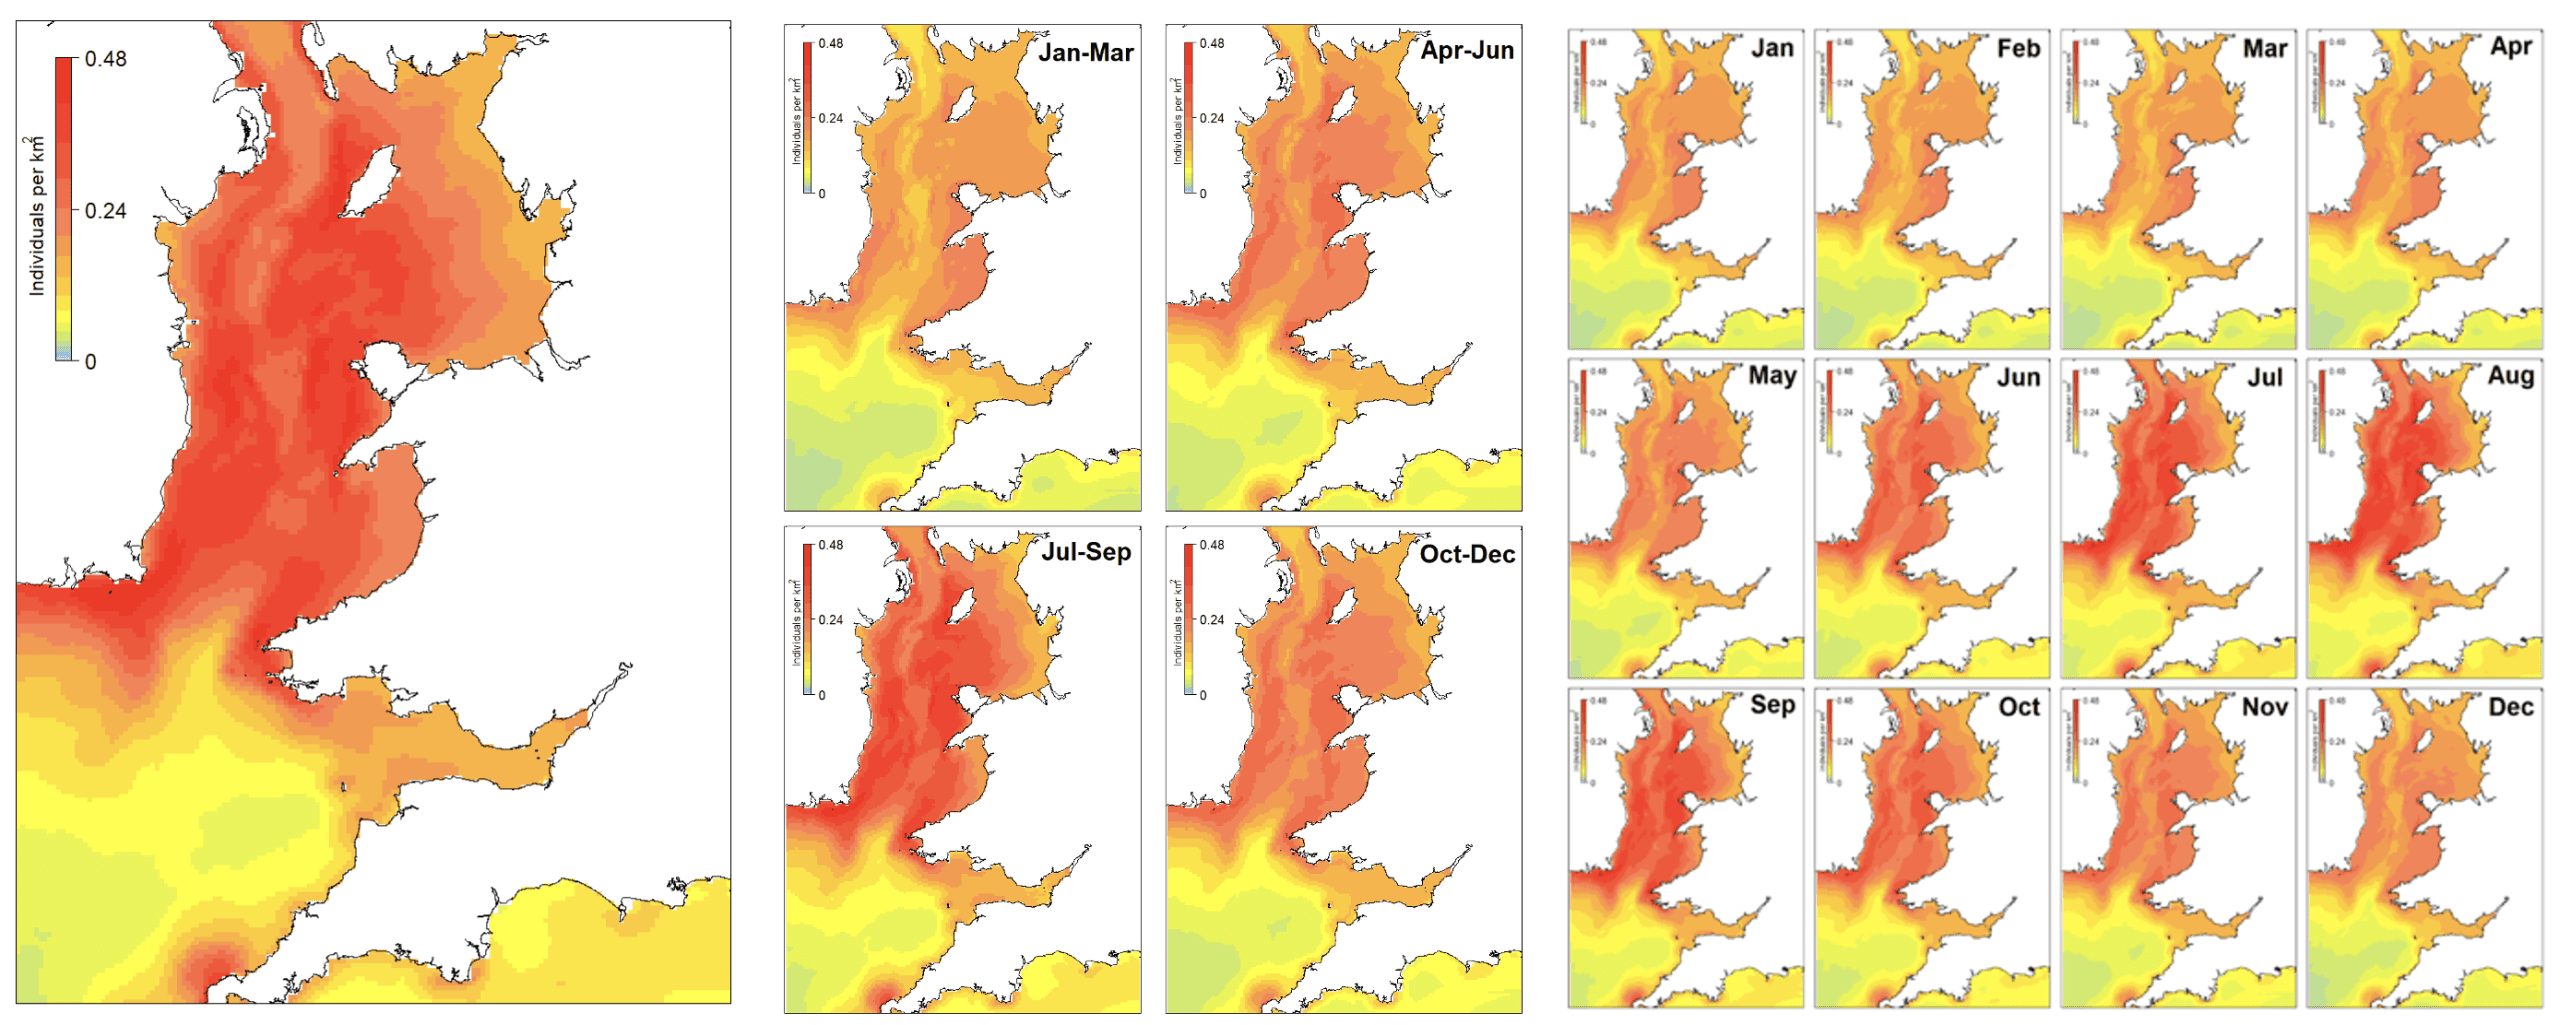
UK monthly maps of harbour porpoise densities.
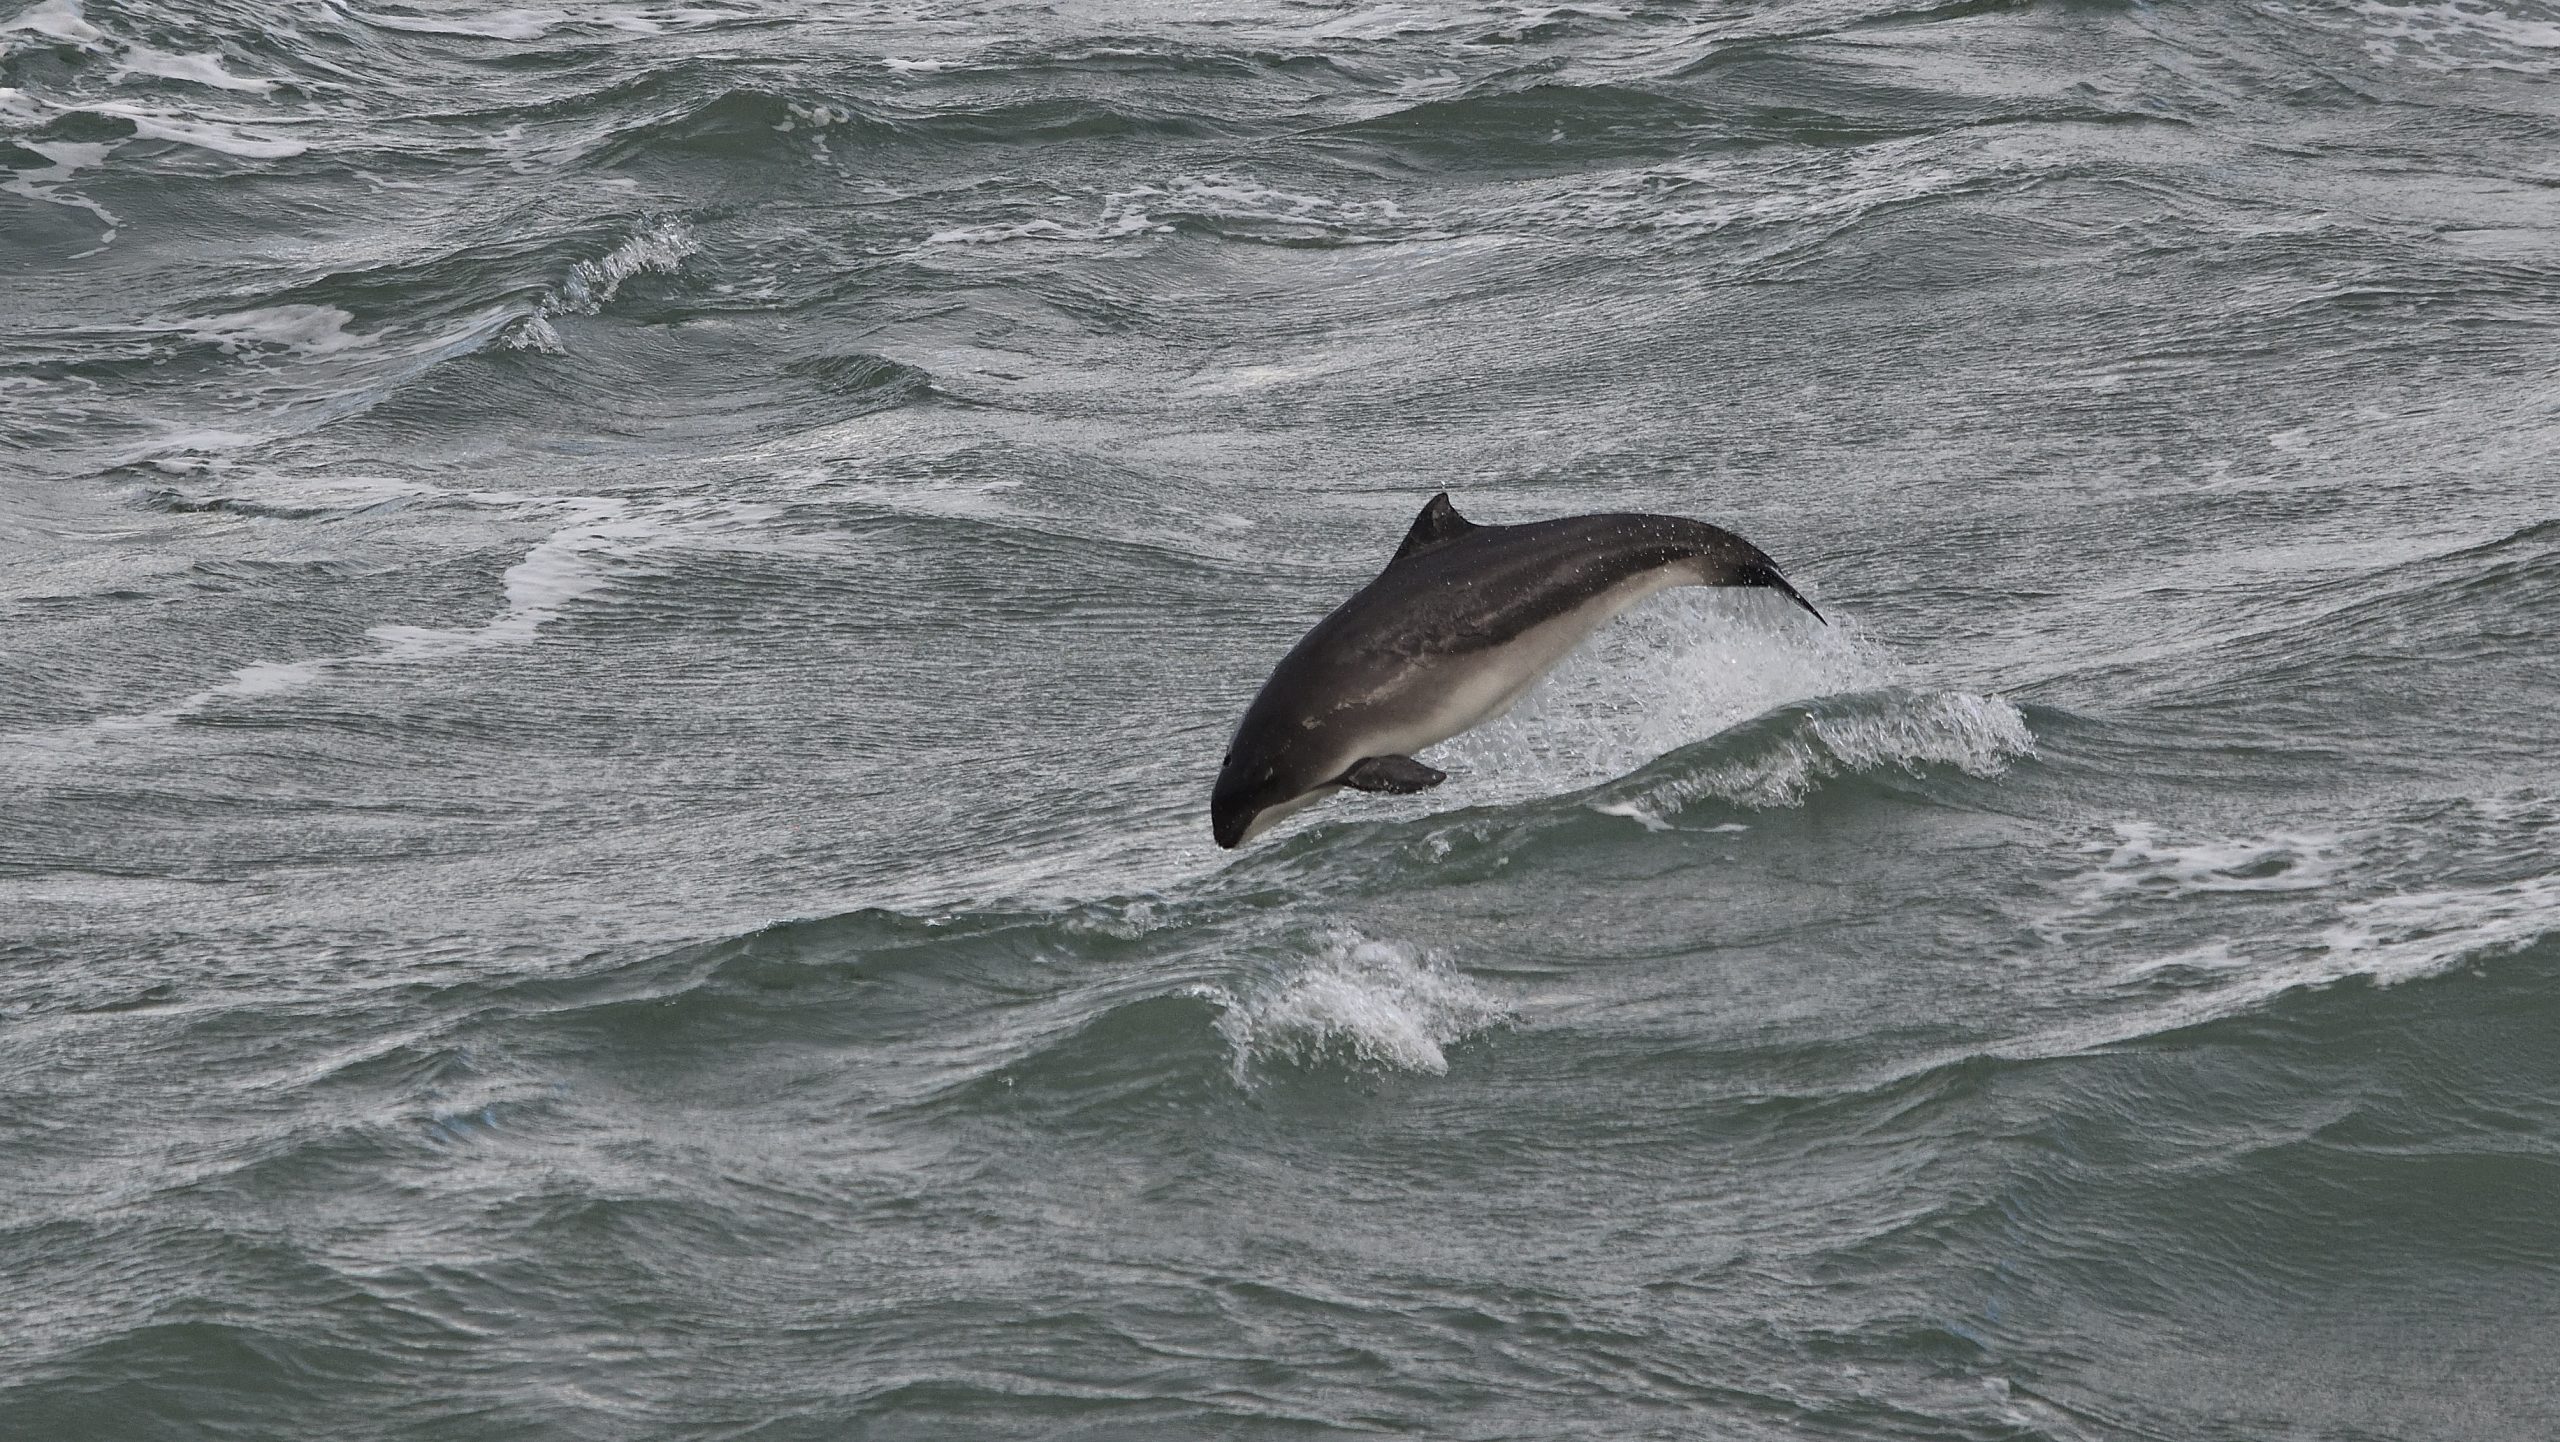
Harbour porpoise
Photo credit: I Jones
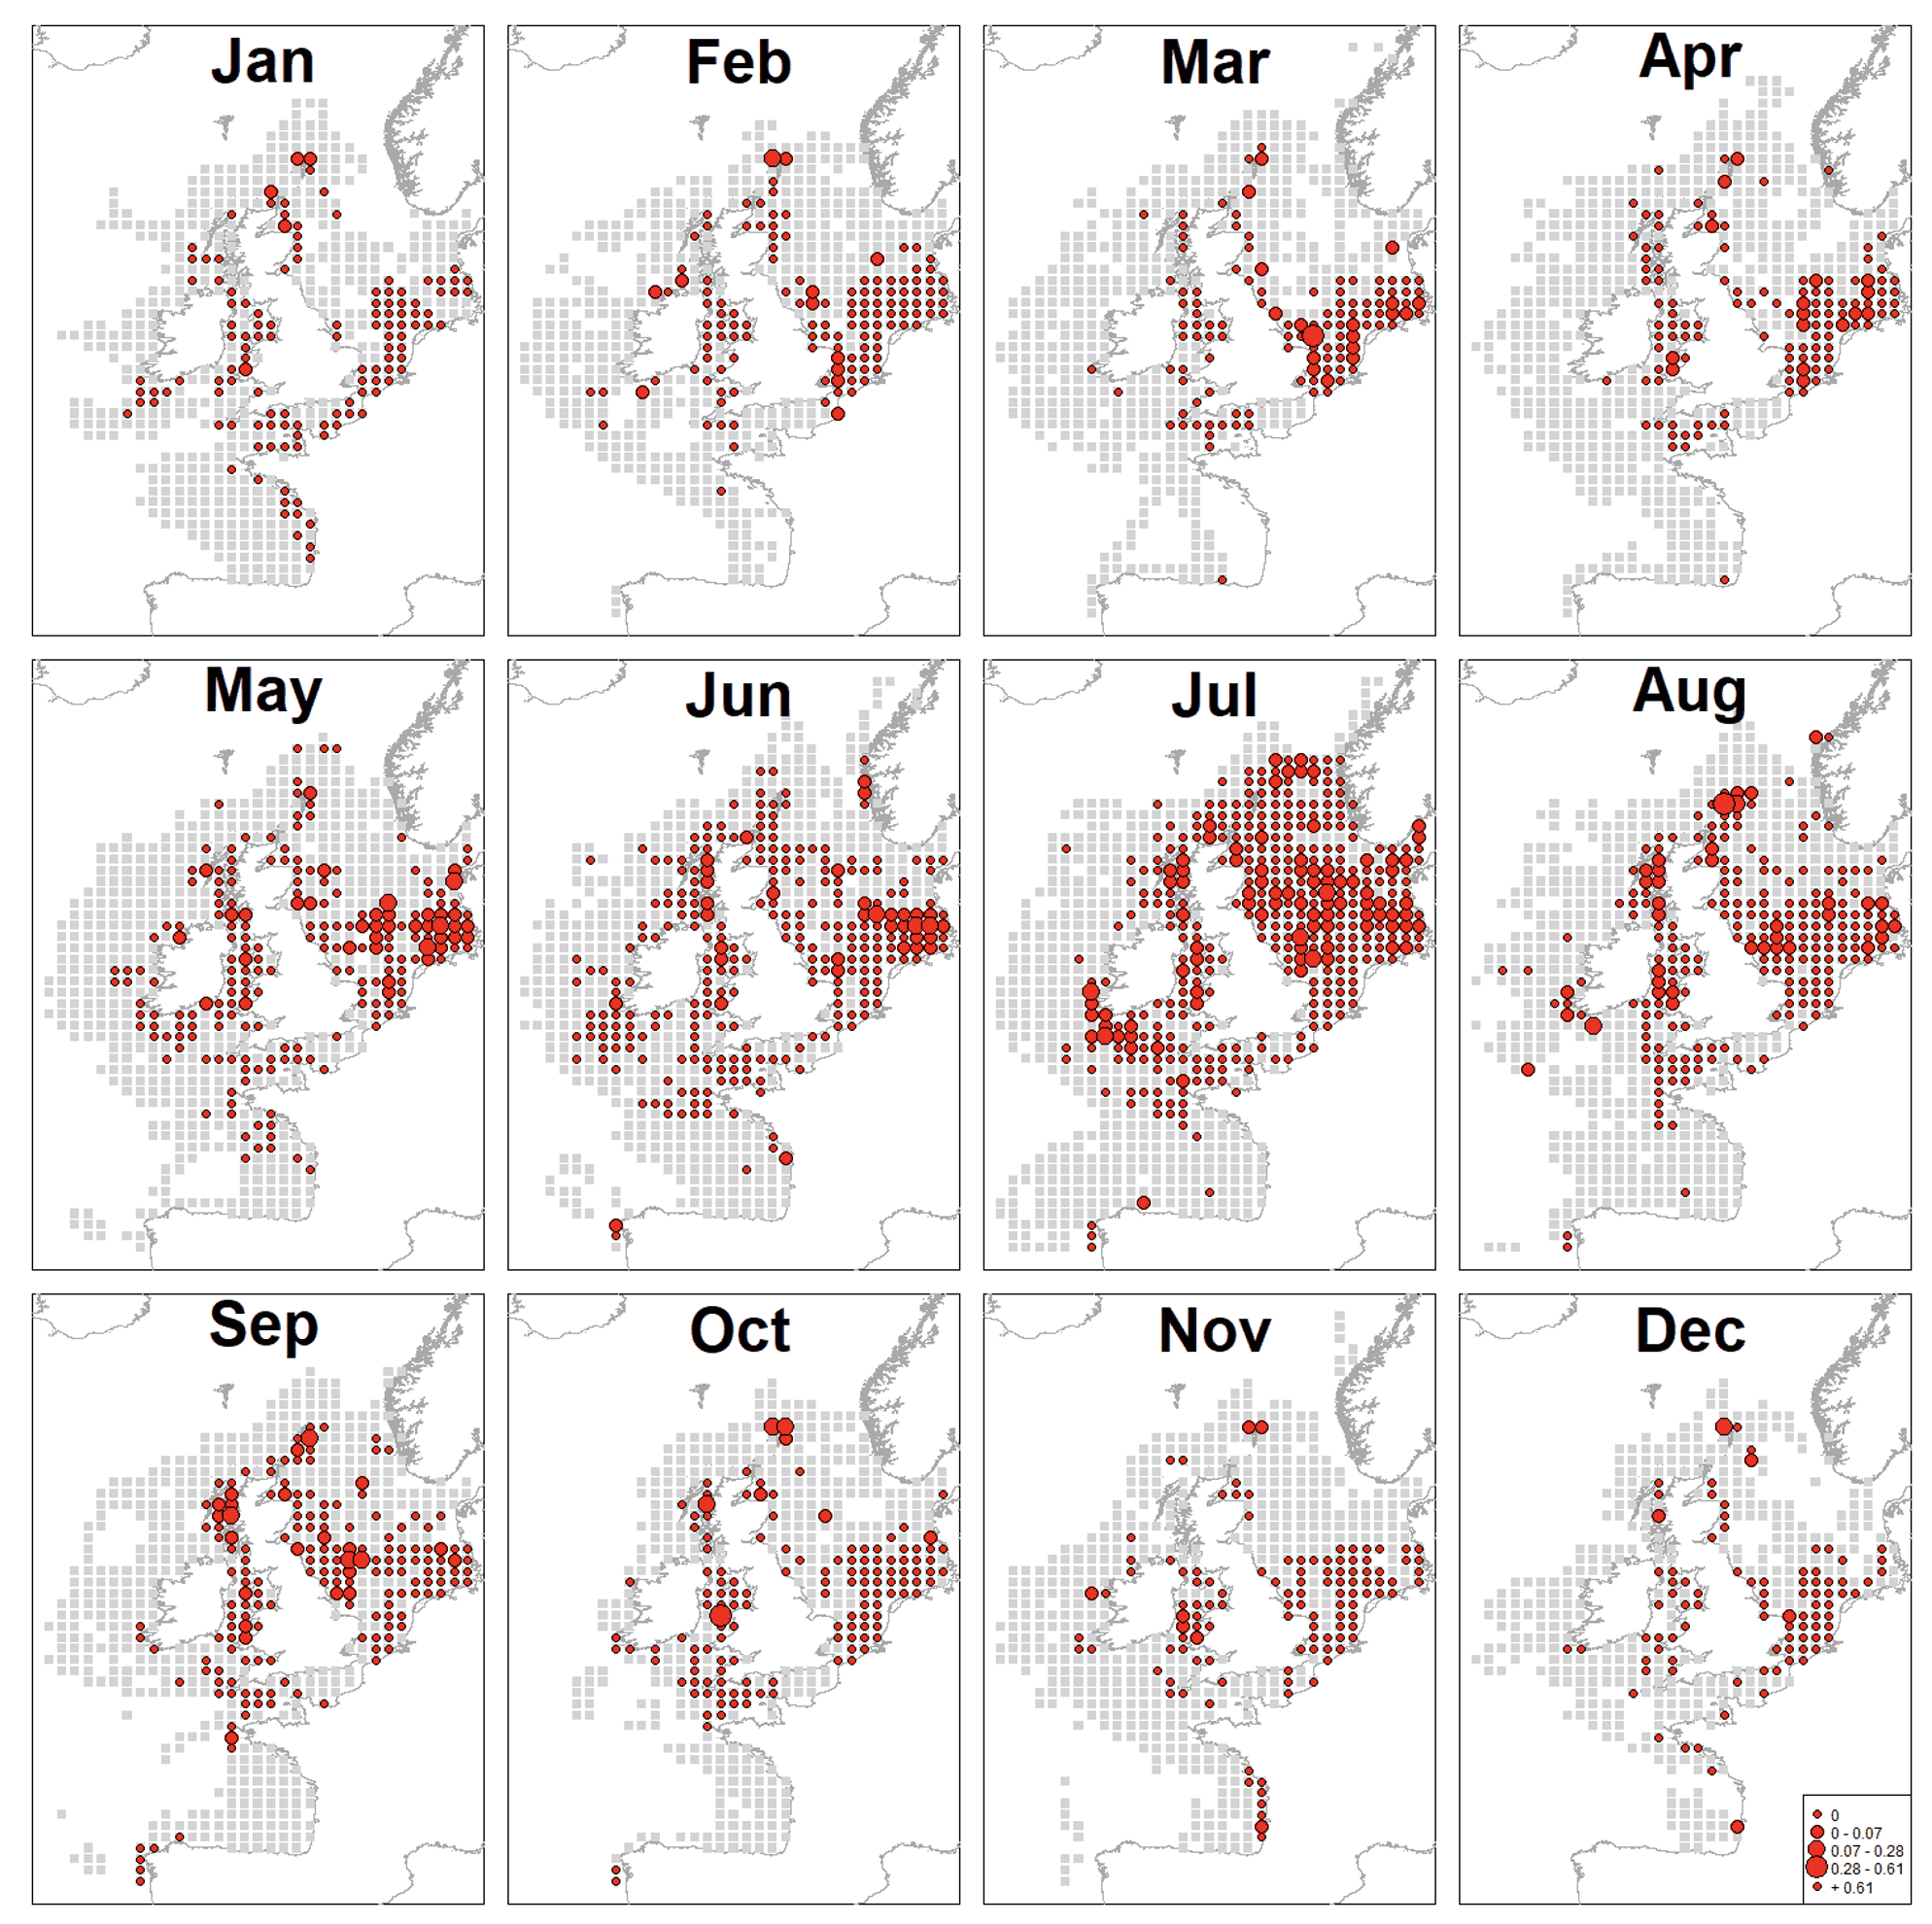
UK monthly summary of harbour porpoise encounter rates.
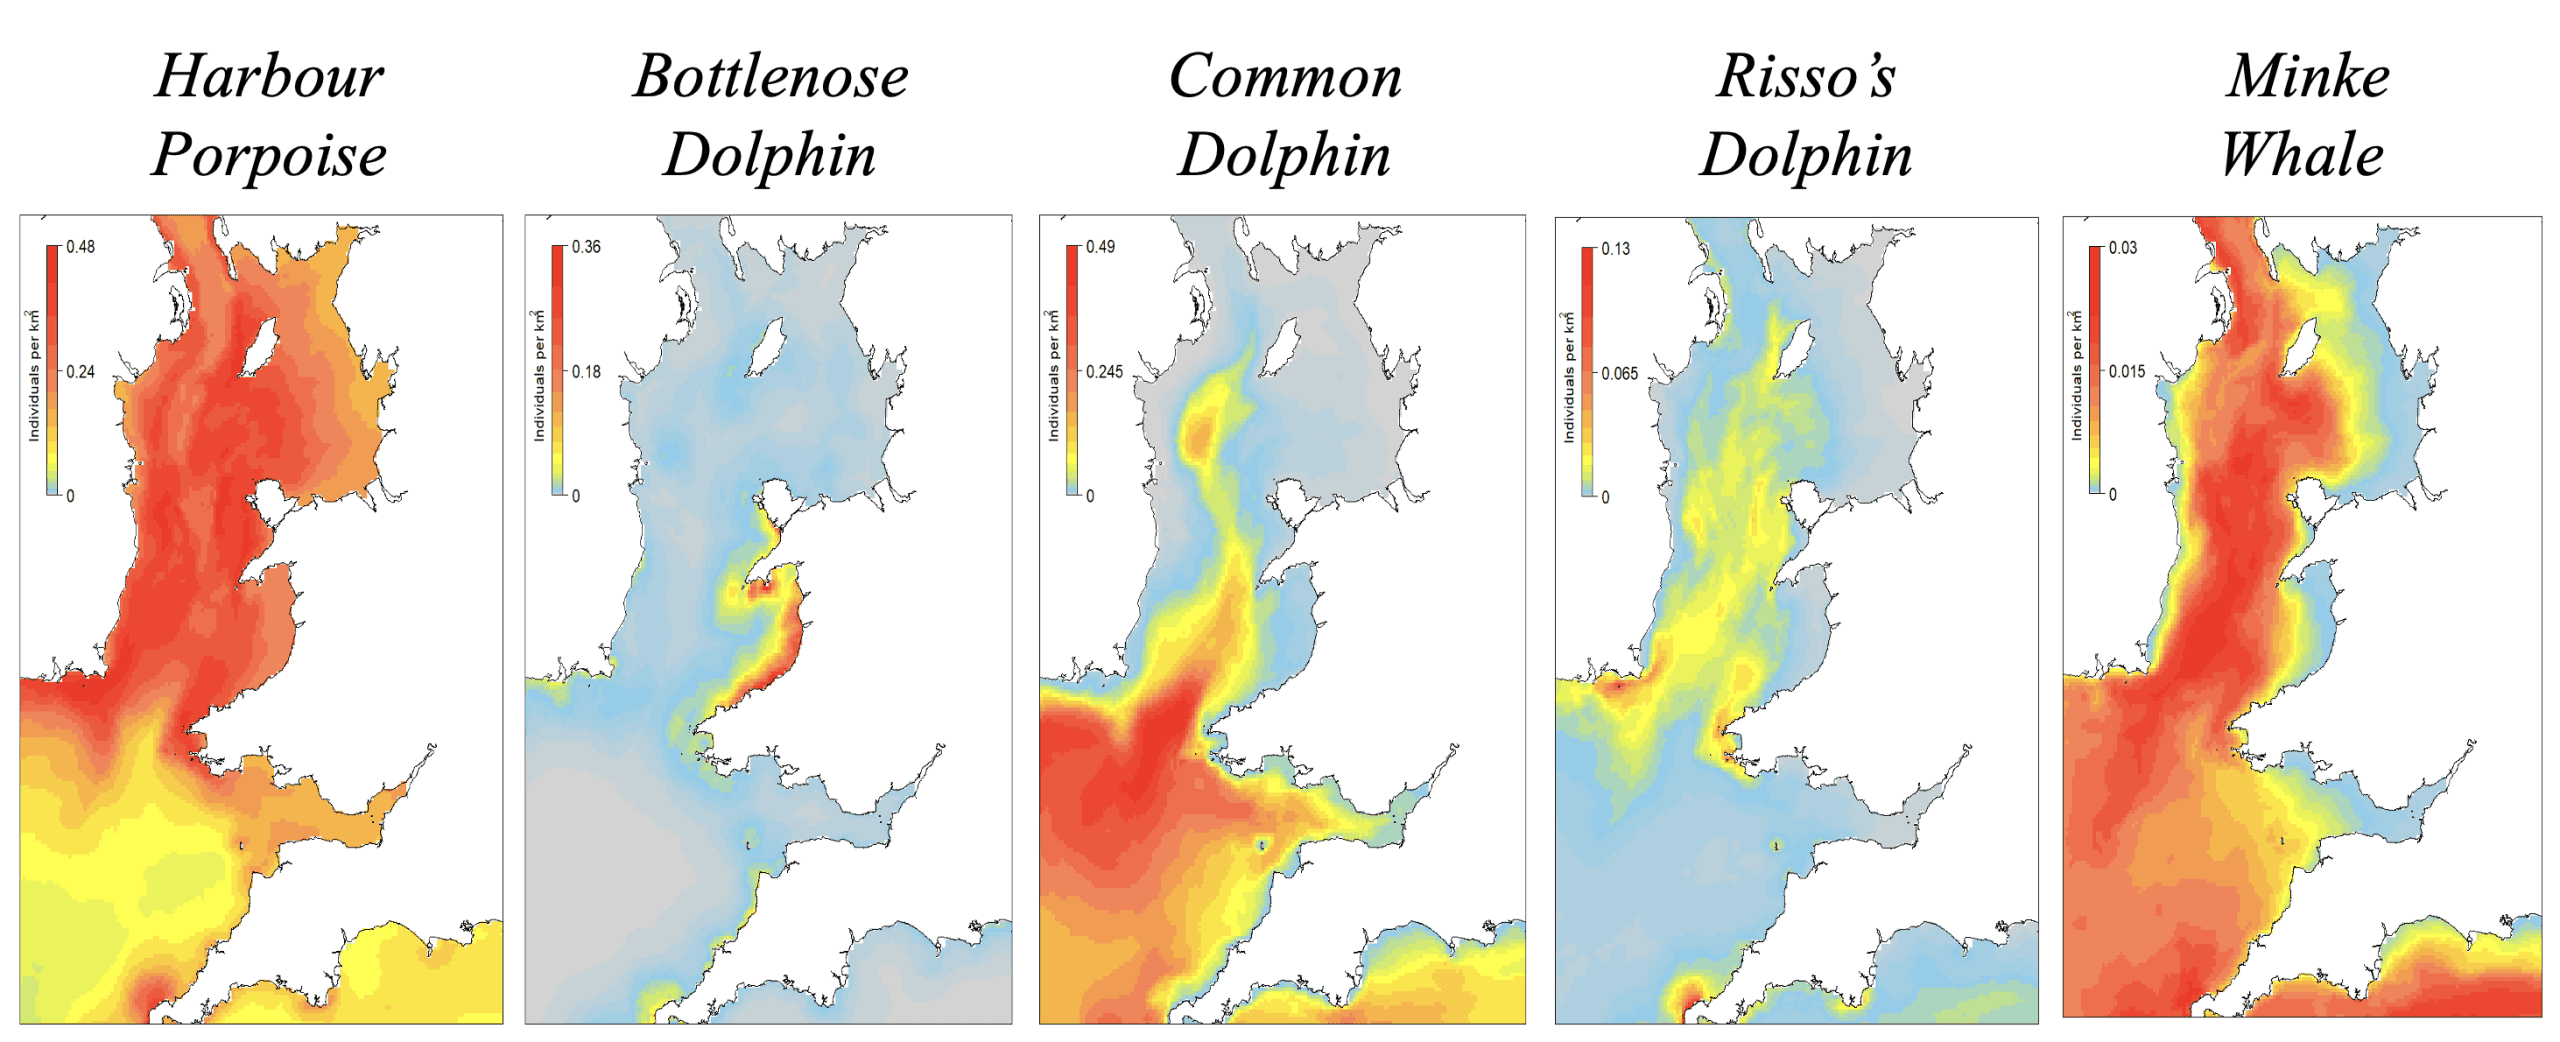
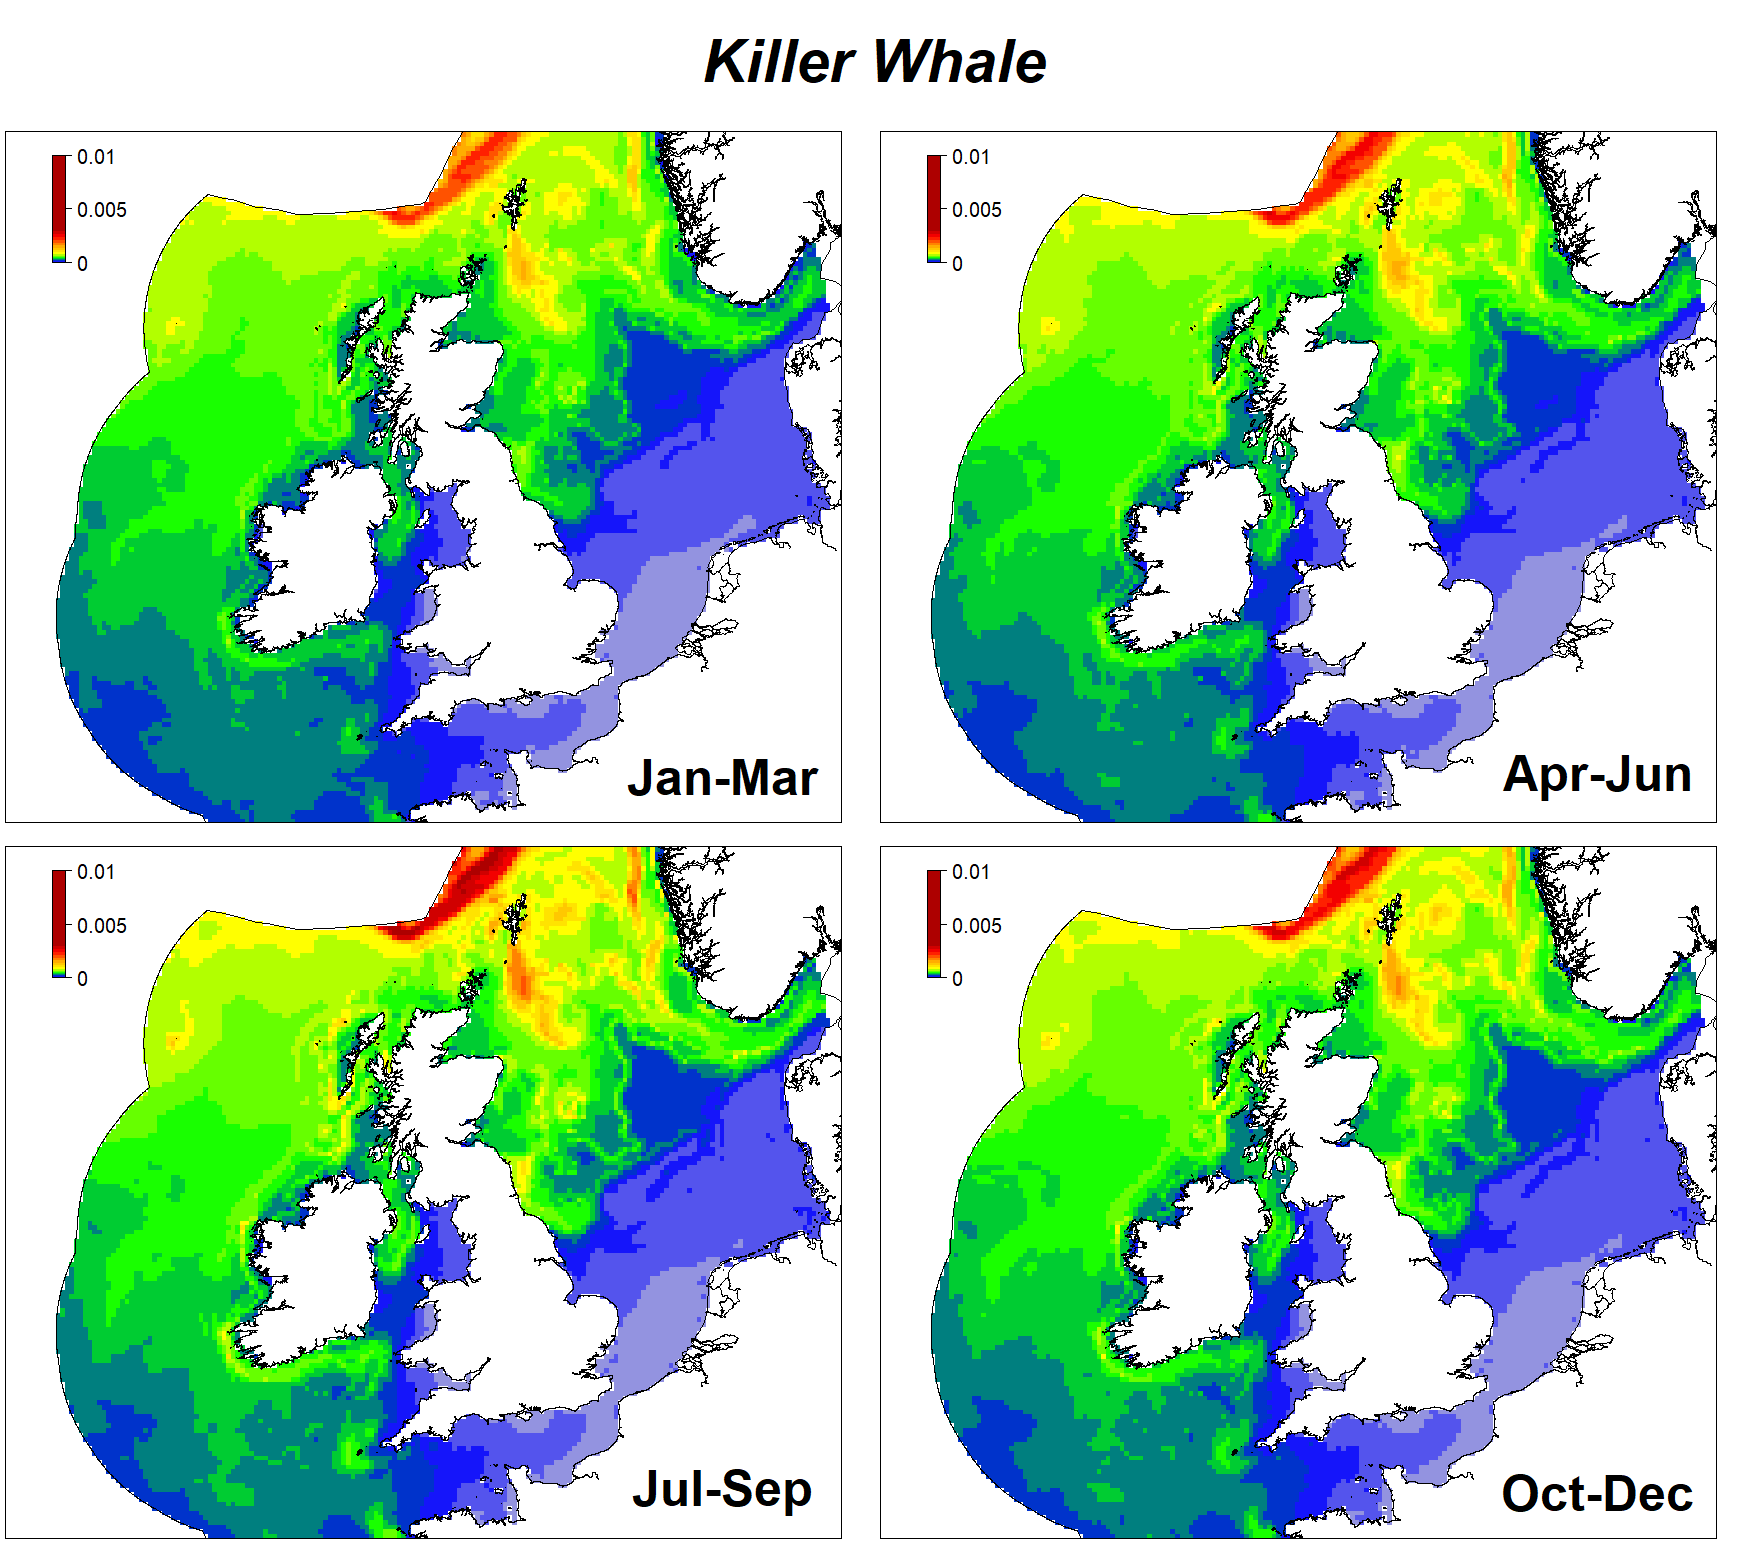
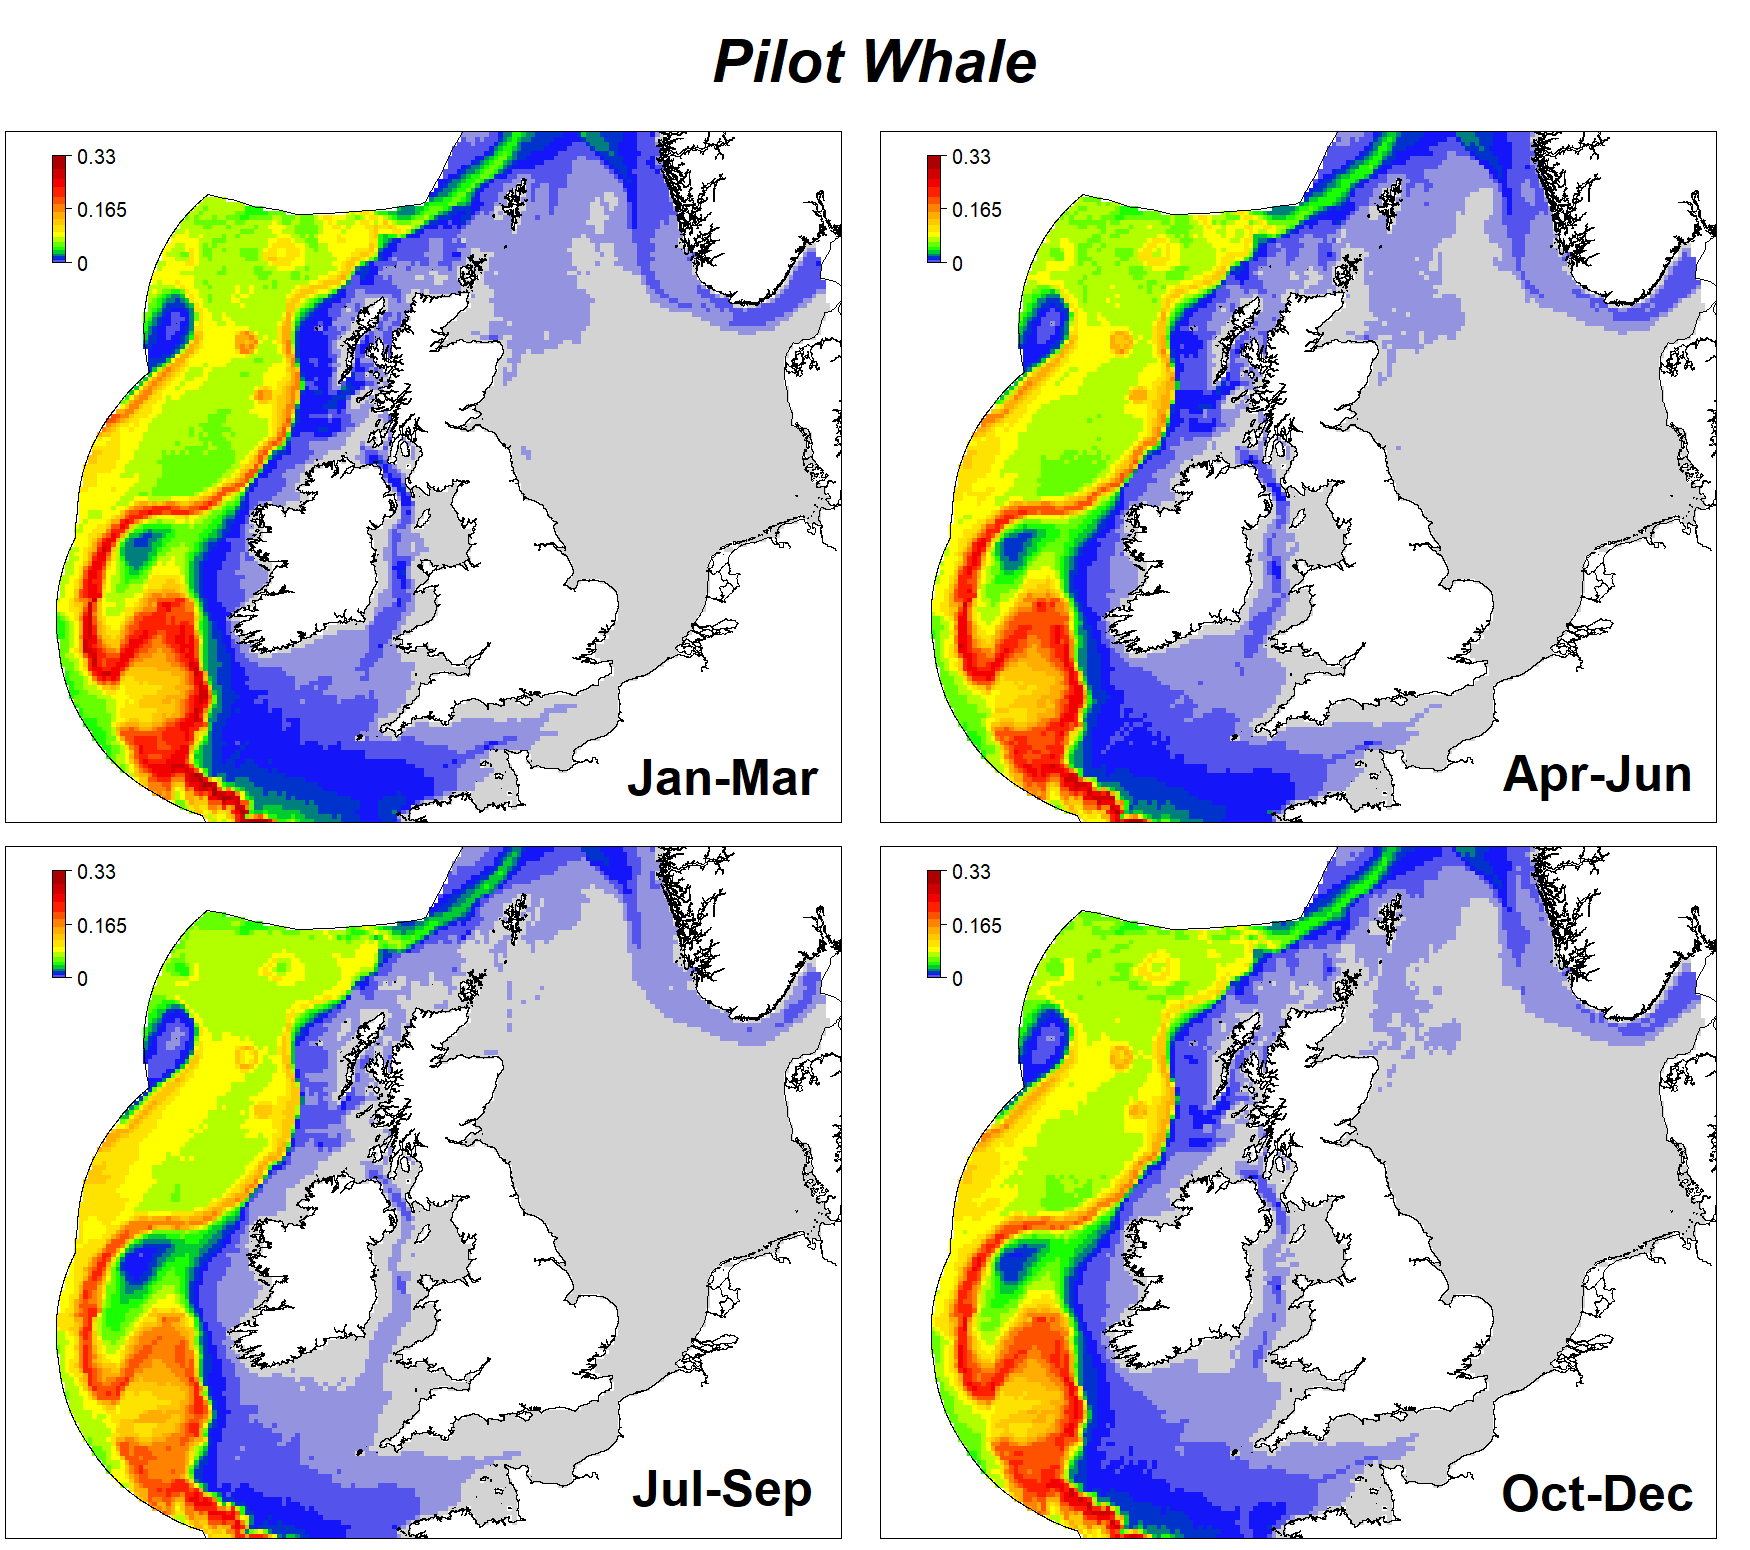
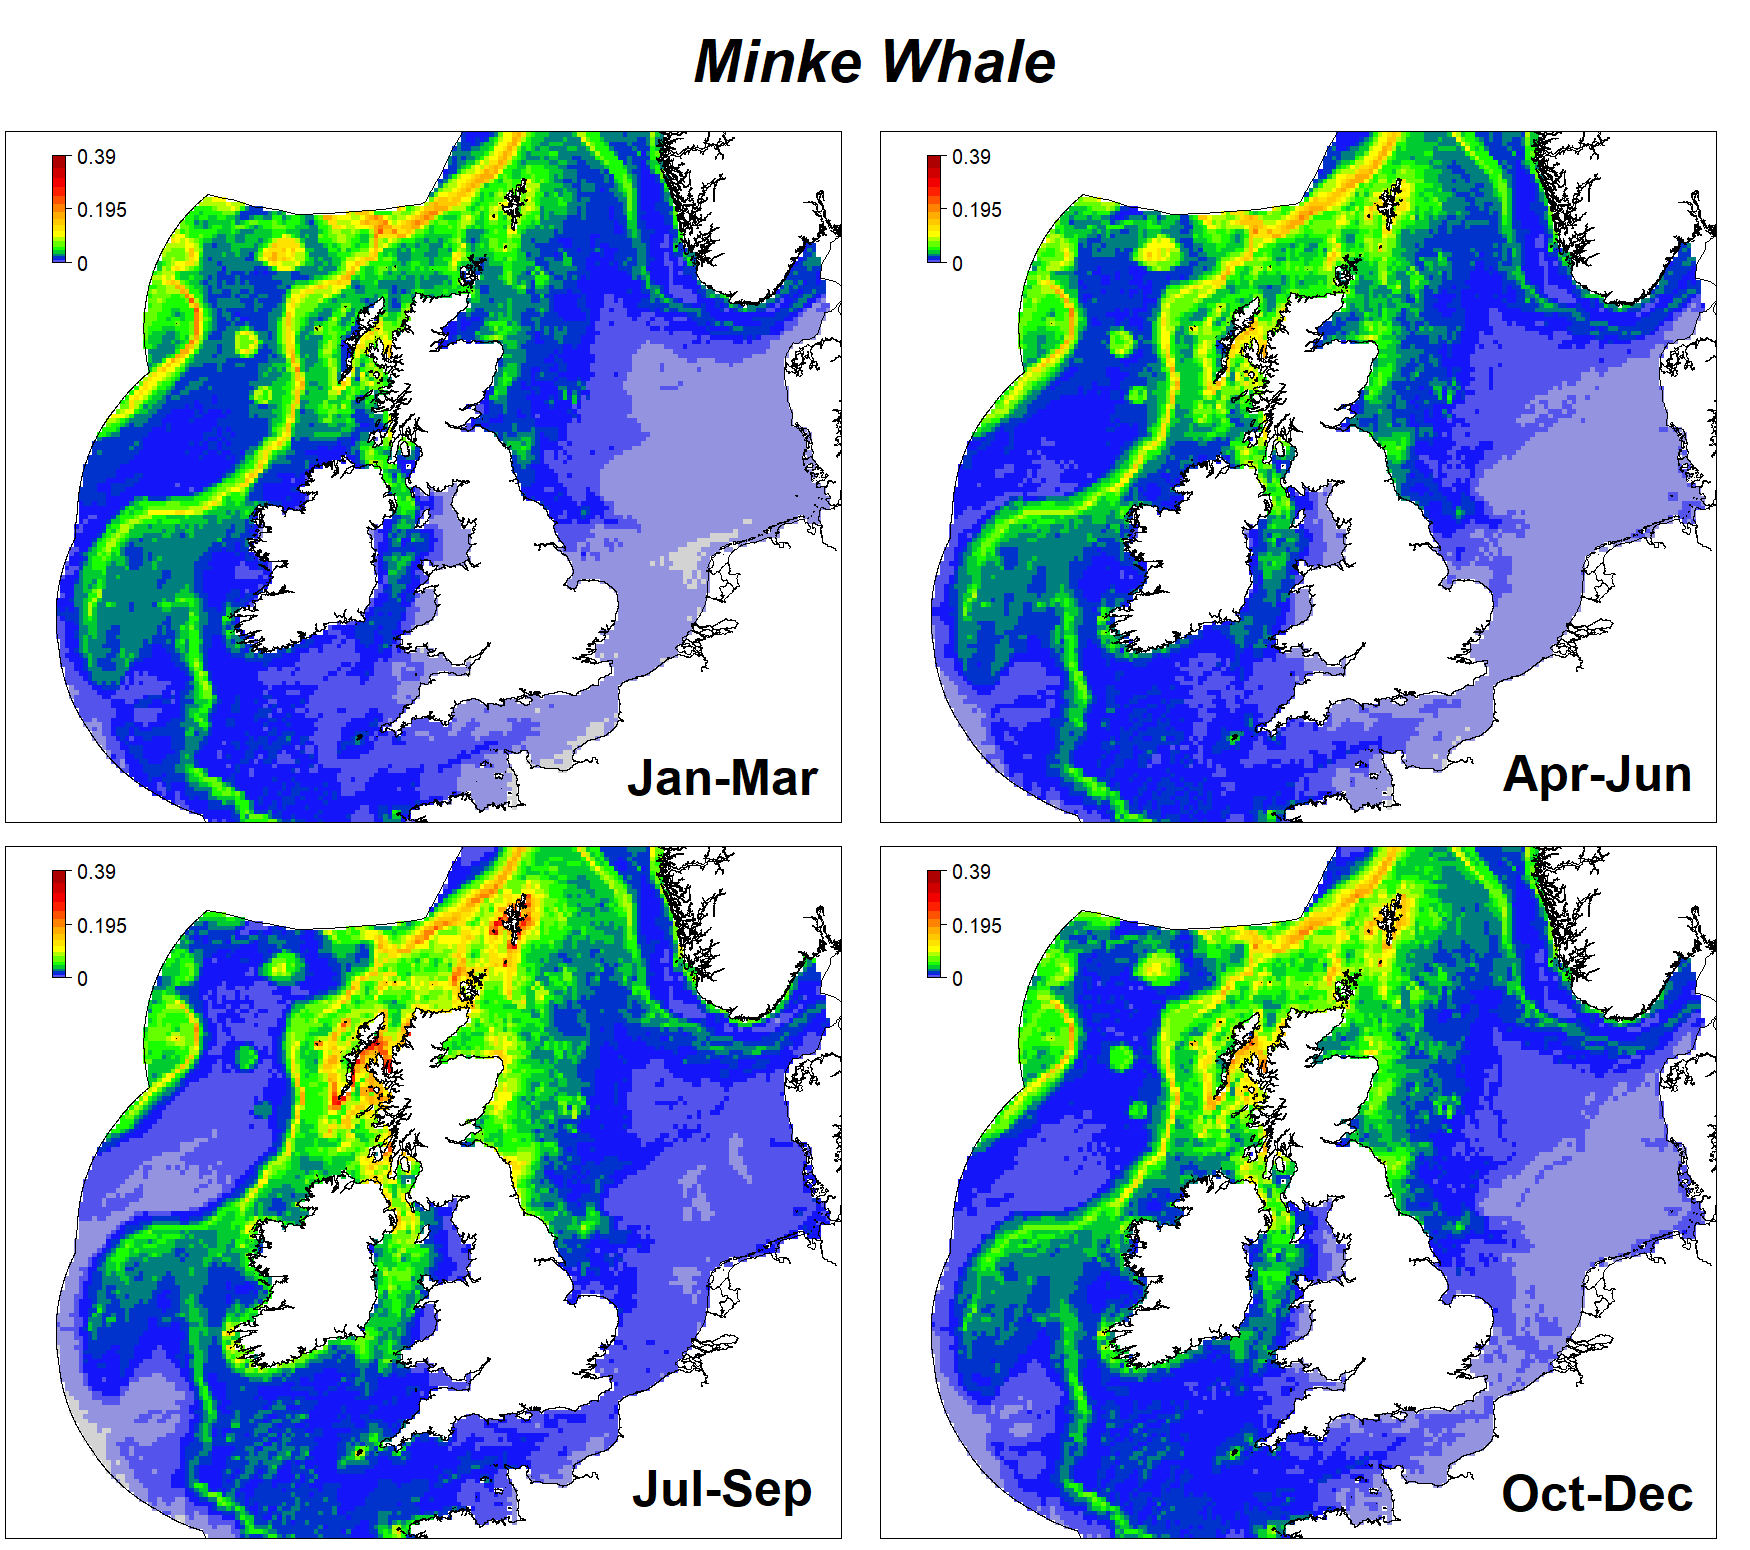
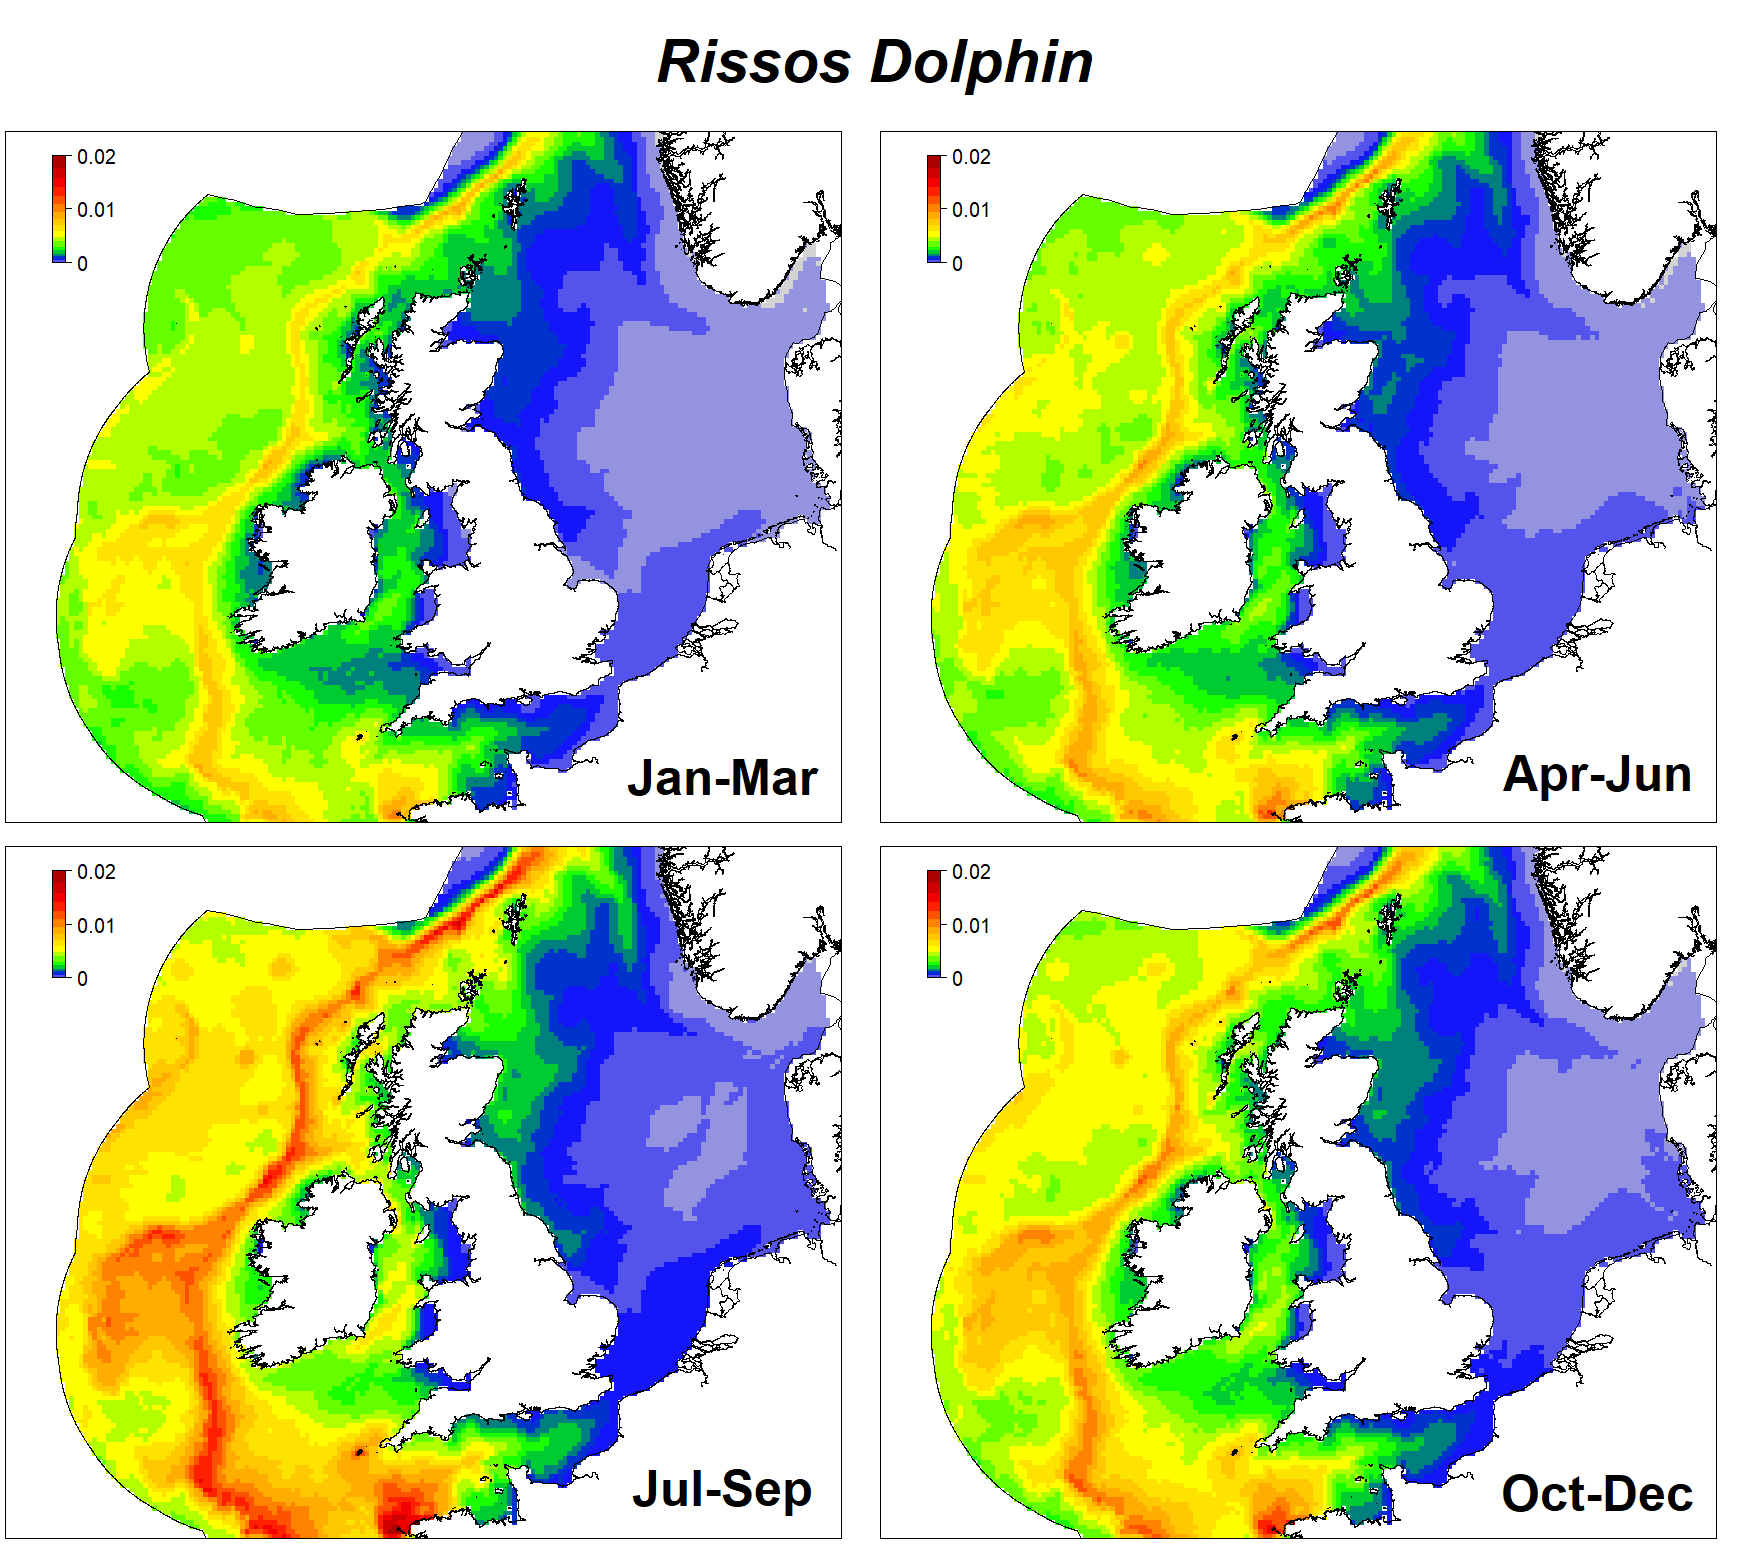
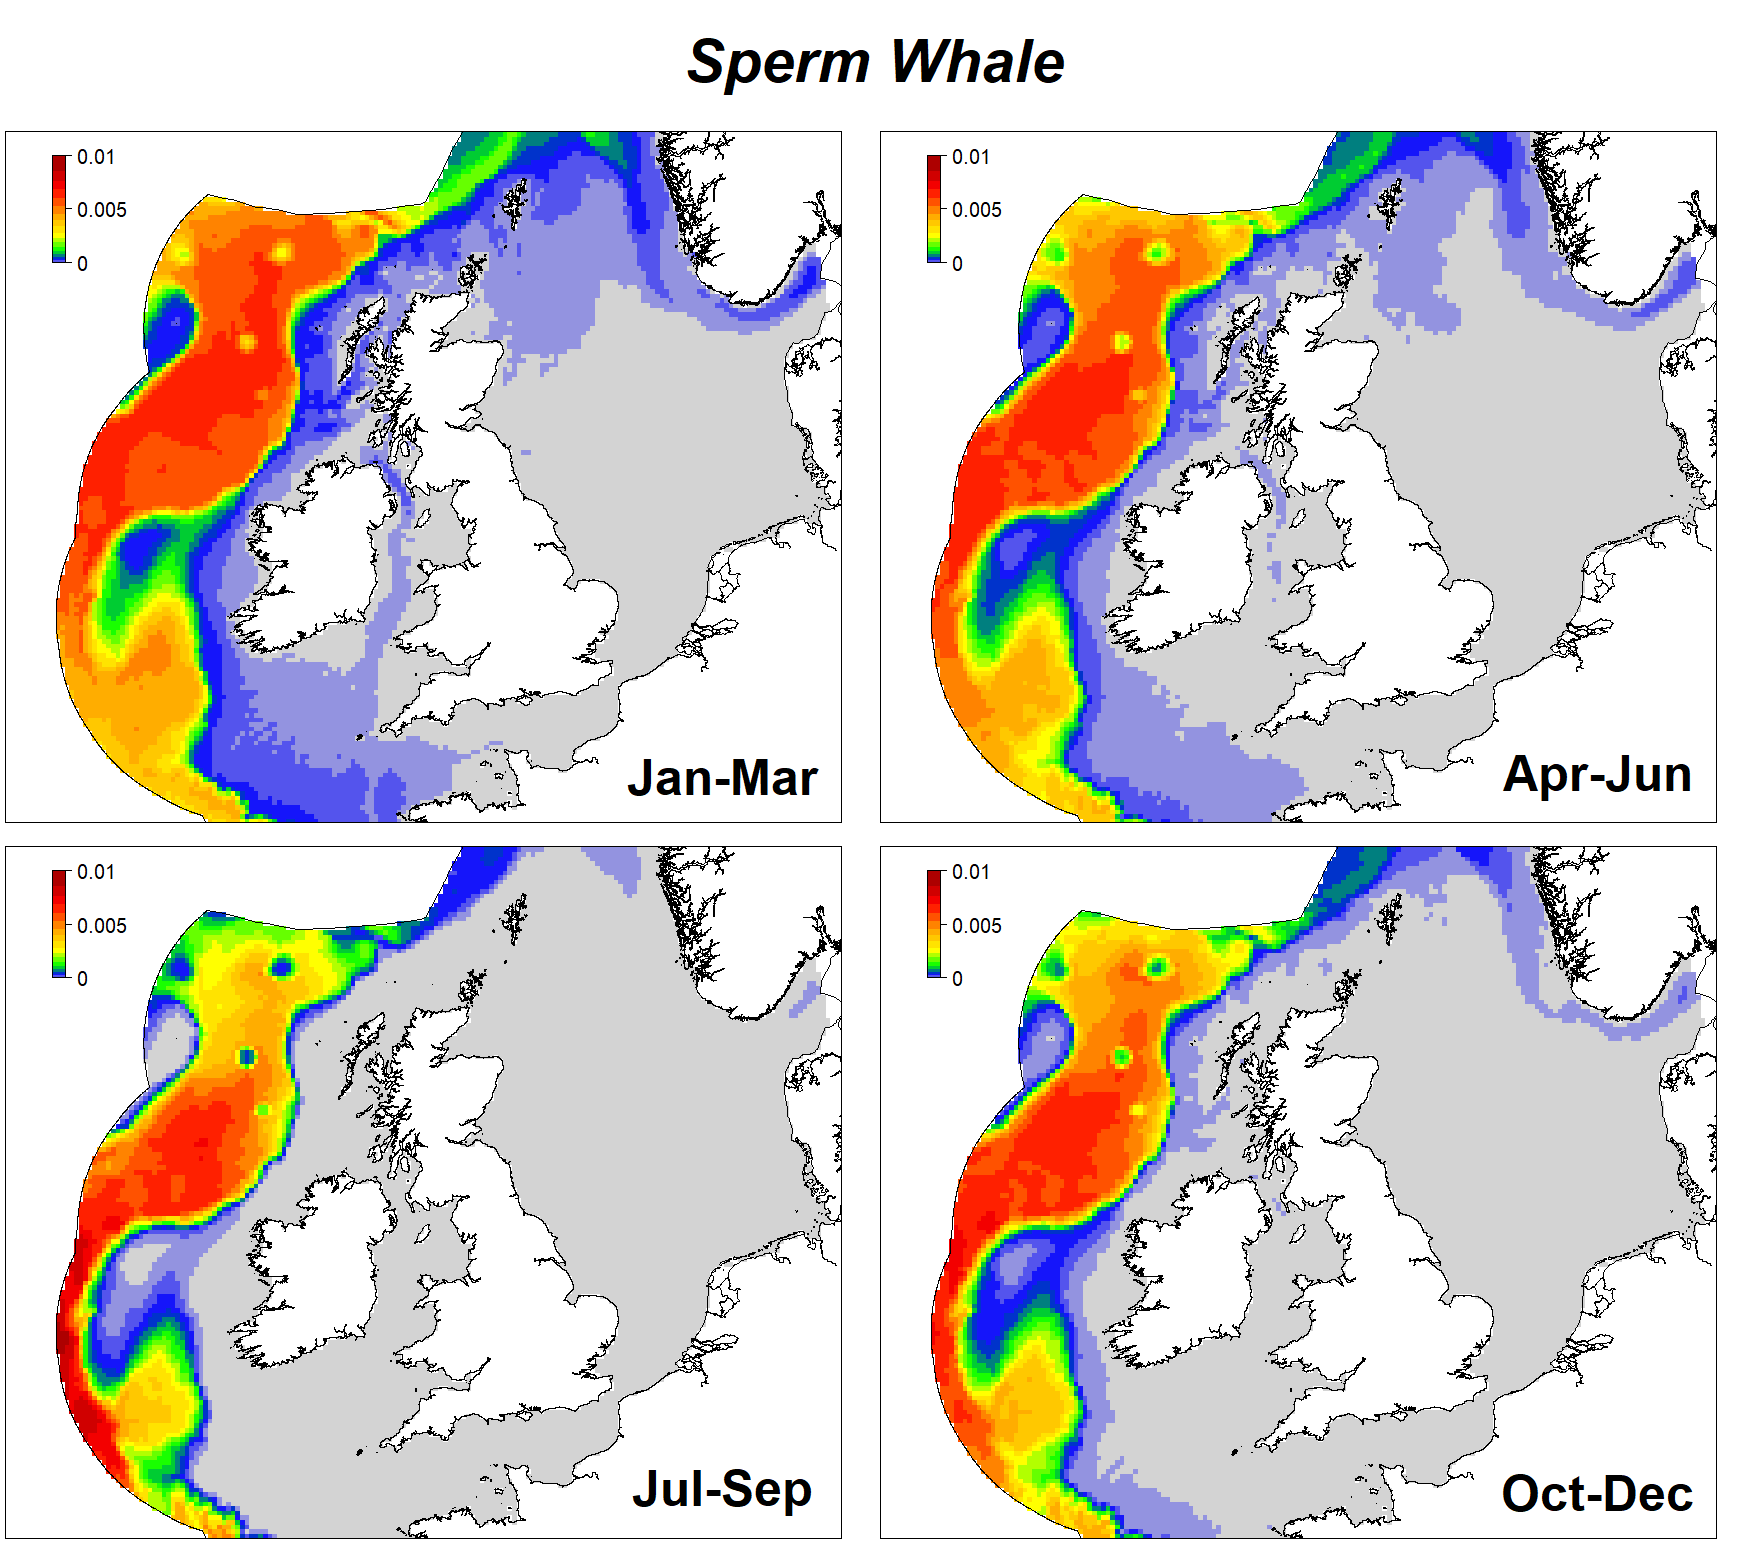
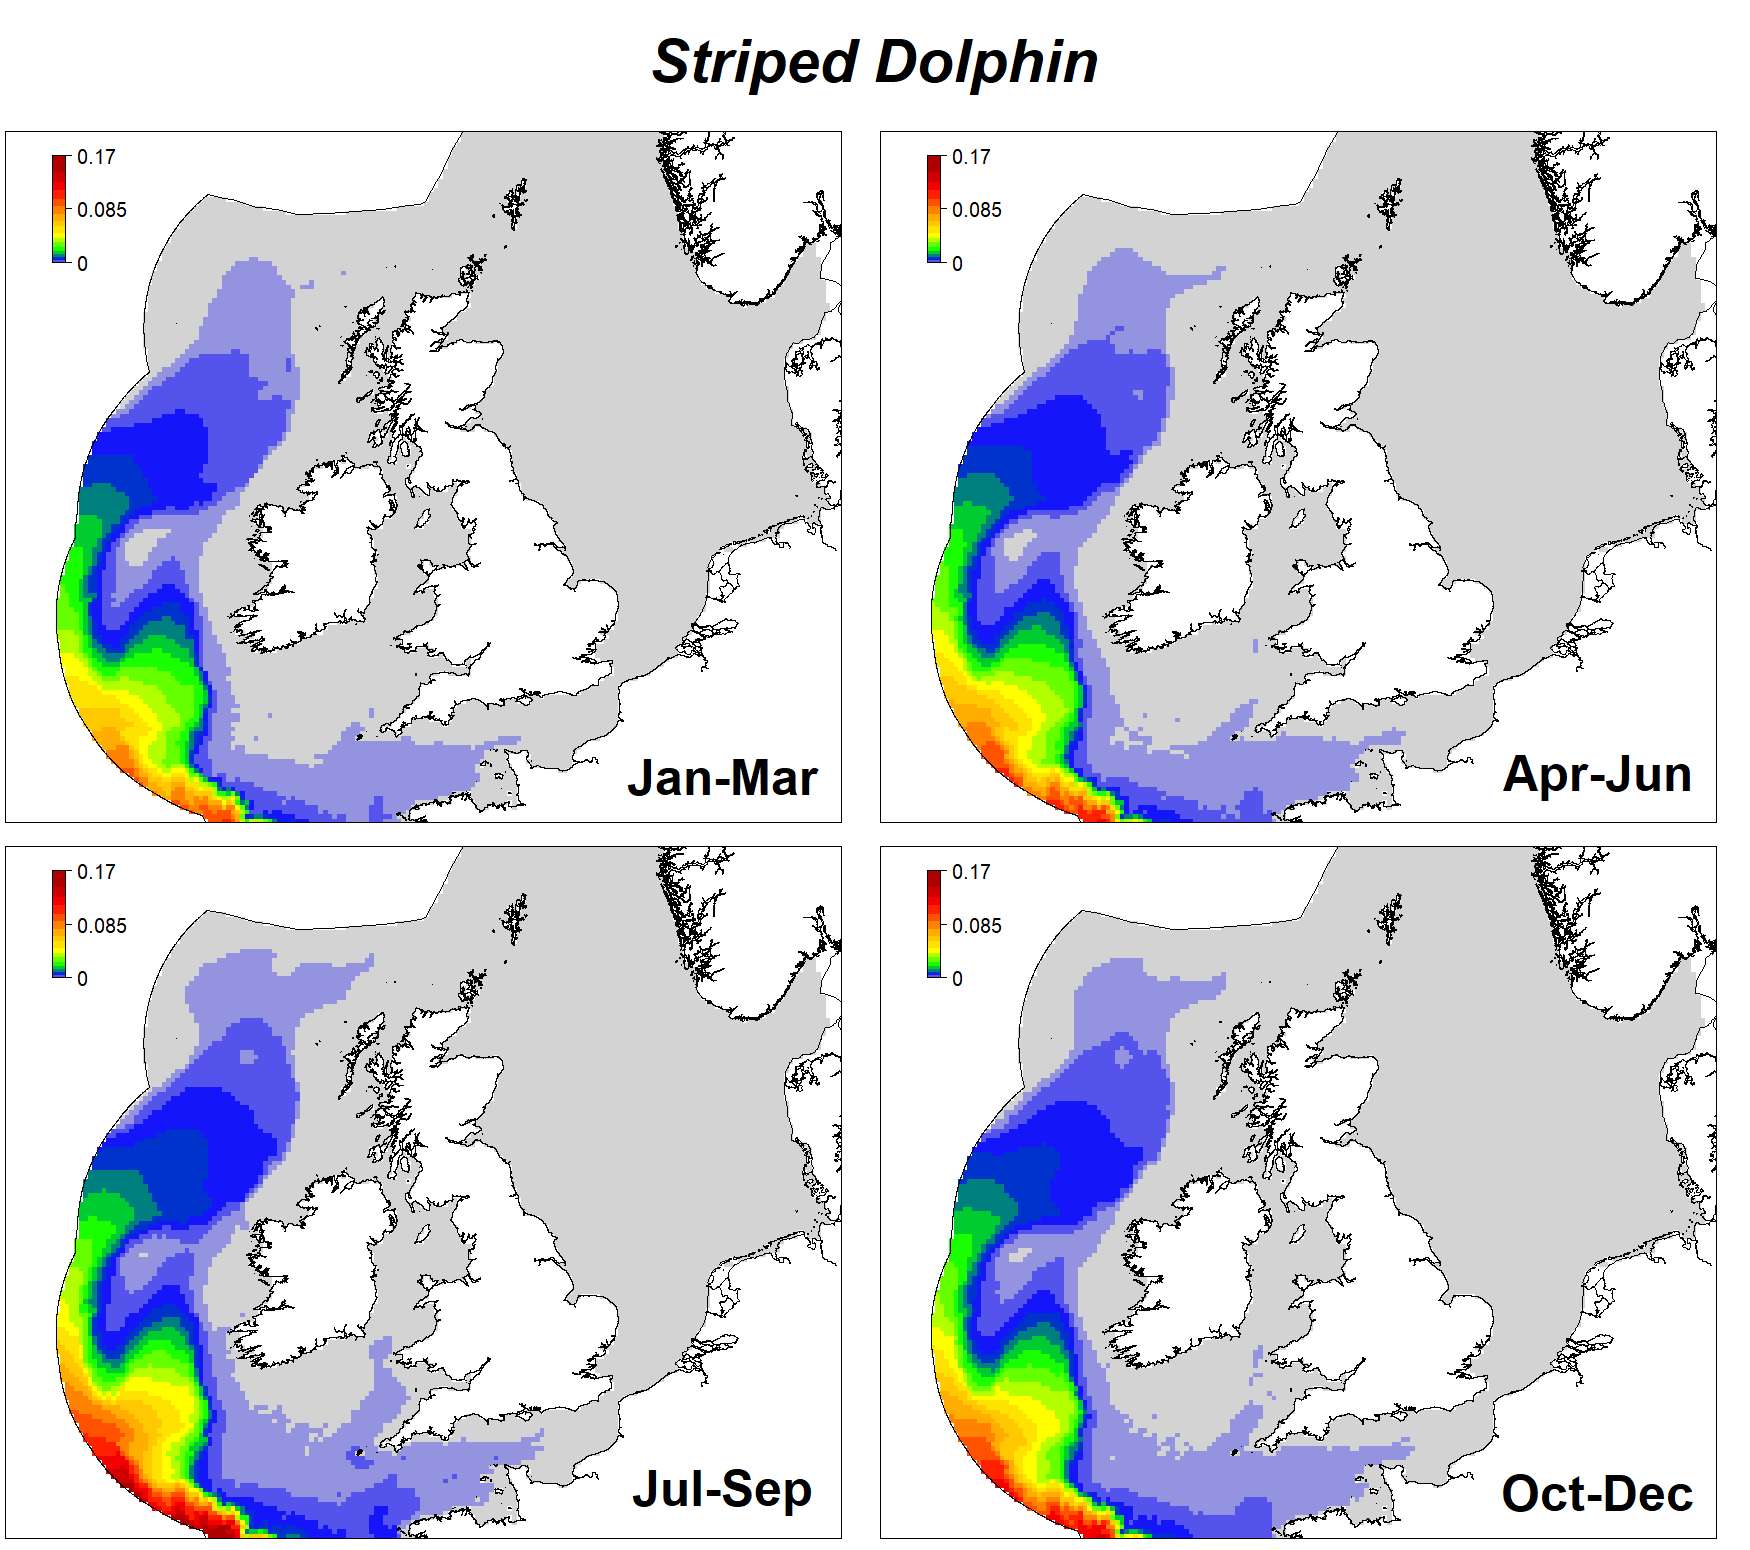
Since then, the maps have been updated, and the models to derive density distributions have been refined. Maps of density distributions of each species were prepared by season using a modelling approach that incorporated environmental variables applying to two oceanographic domains: southern Scandinavia to NW France (northern) and NW France to southern Portugal (southern). These were based upon 1.25 million kilometres of dedicated survey effort for the northern domain, and 0.82 million kilometres for the southern domain, provided by 47 research groups, with surveys undertaken across the period 2005 to 2020. The results have been published in a report by Evans et al. (2021) for the European Commission, which can be downloaded HERE. The resultant maps for the northern region around the British Isles can be seen for each of the twelve species occurring regularly.
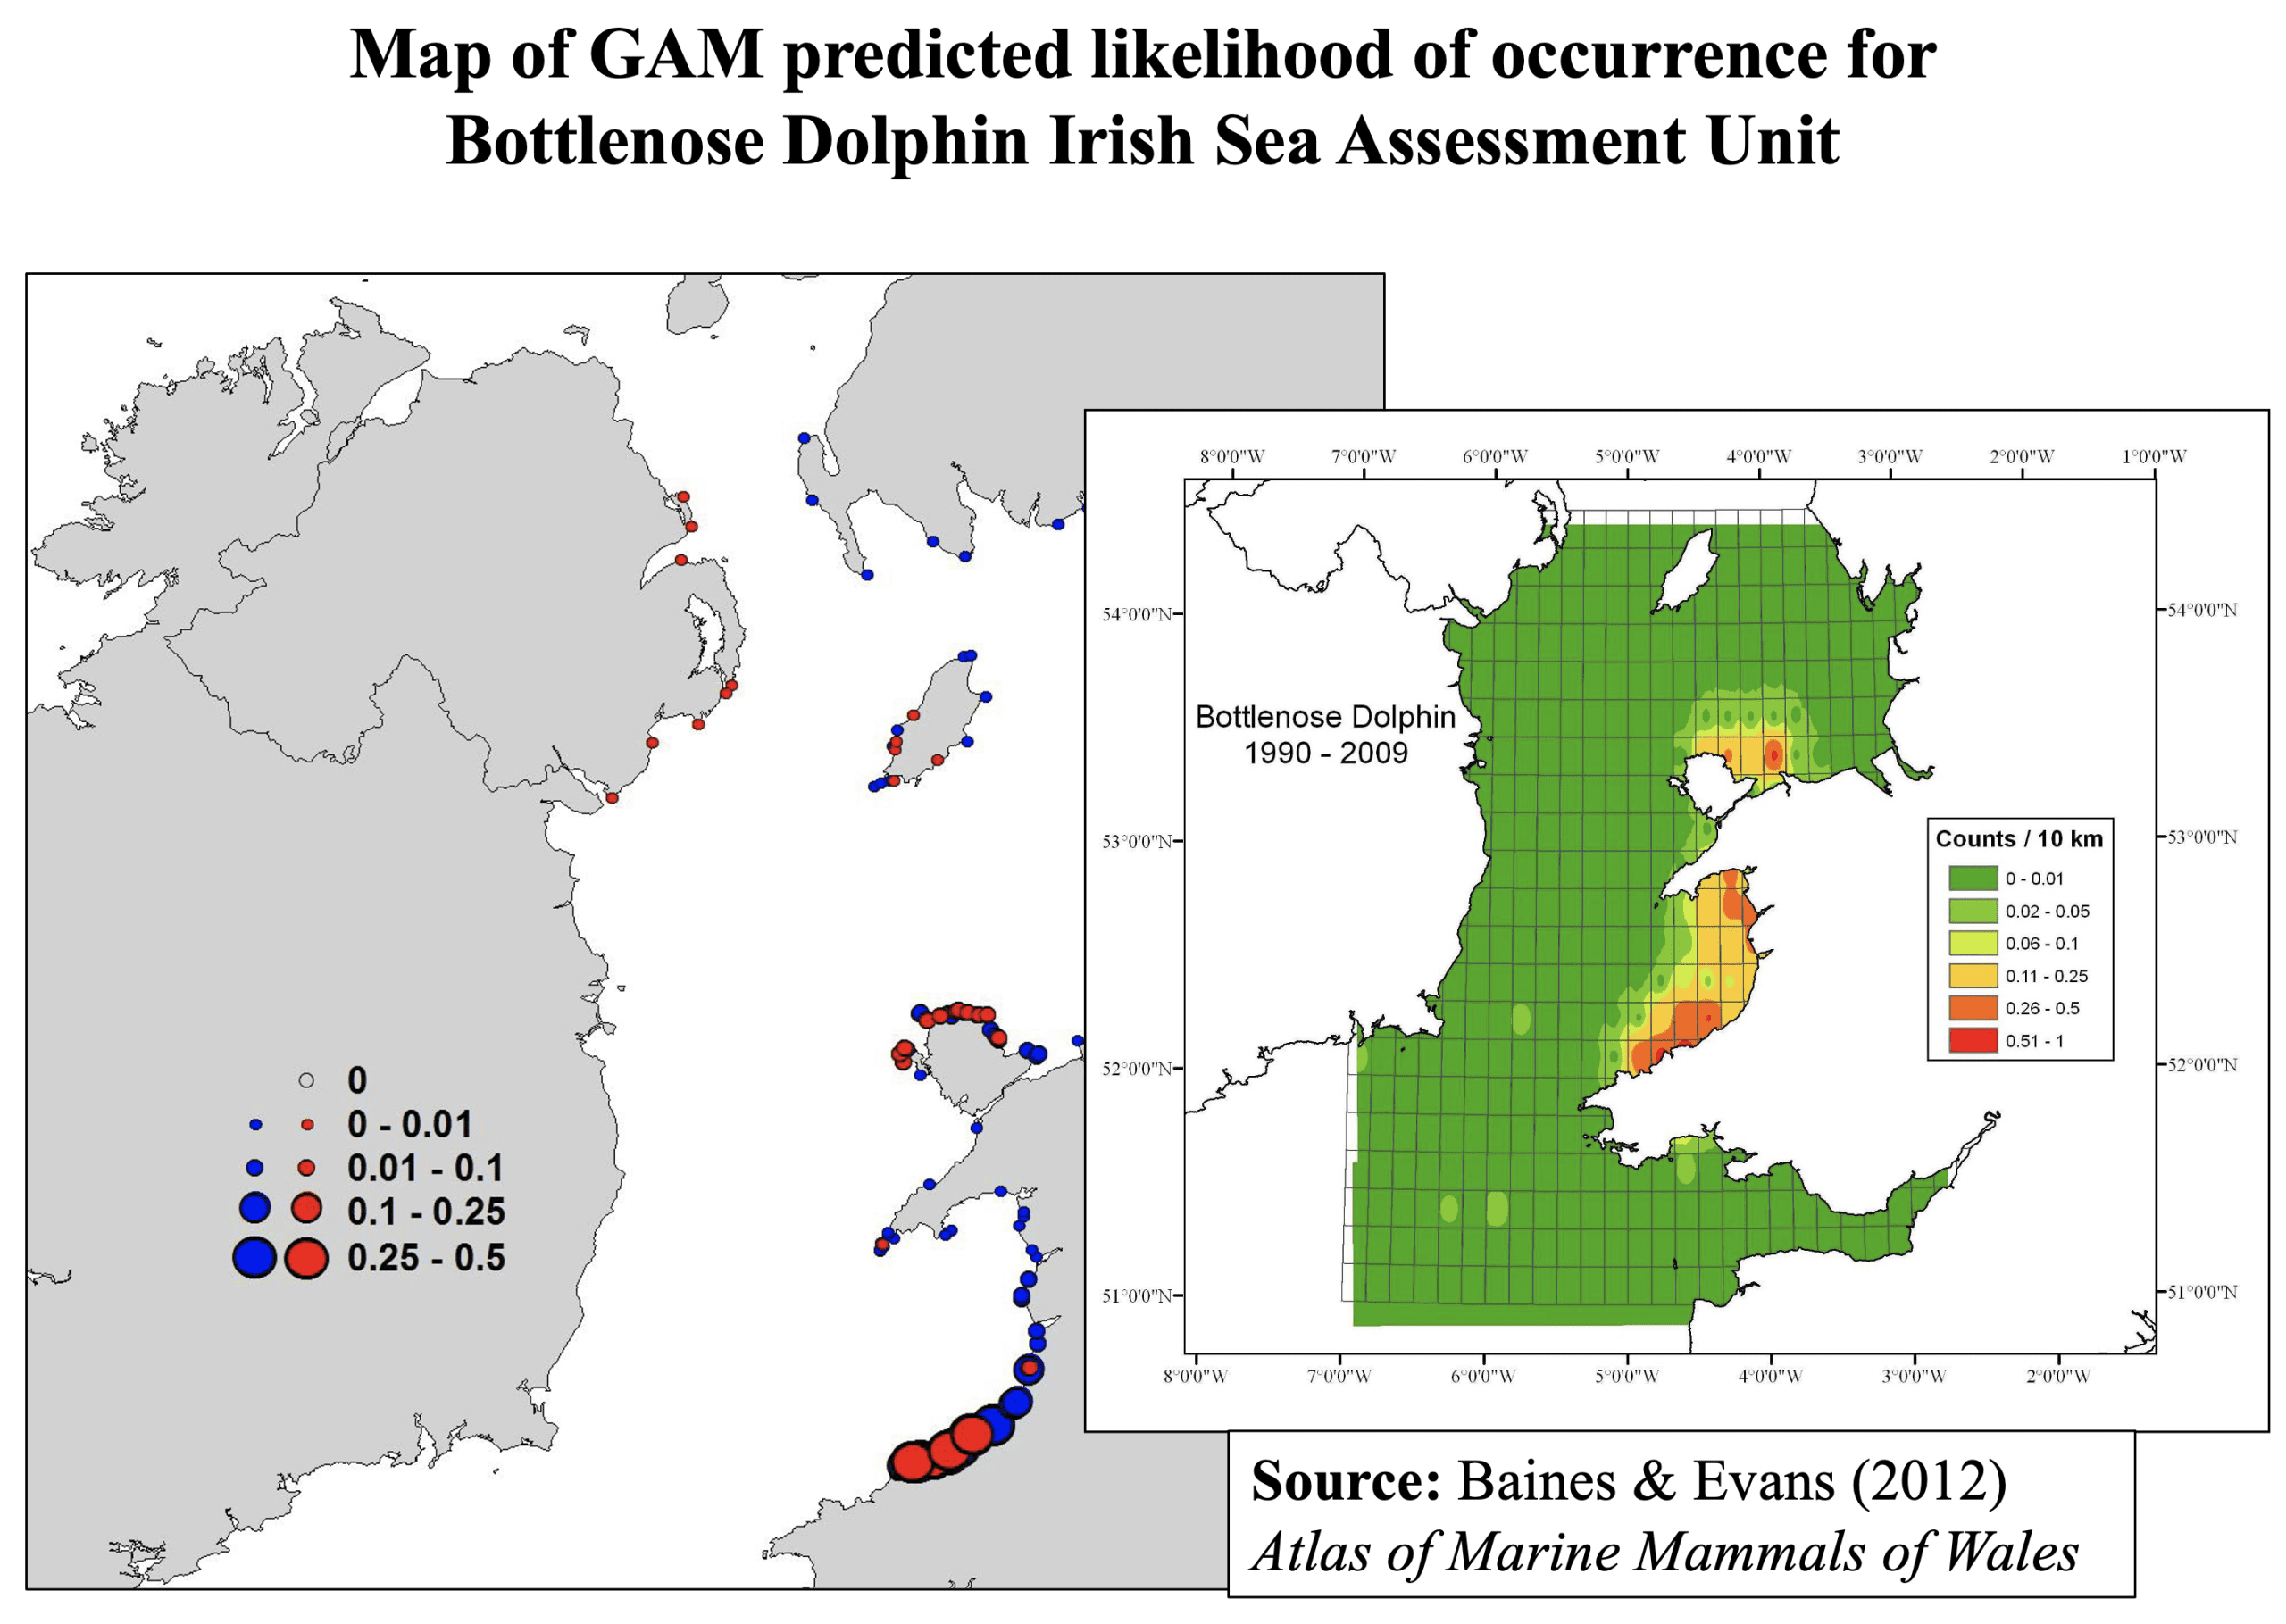
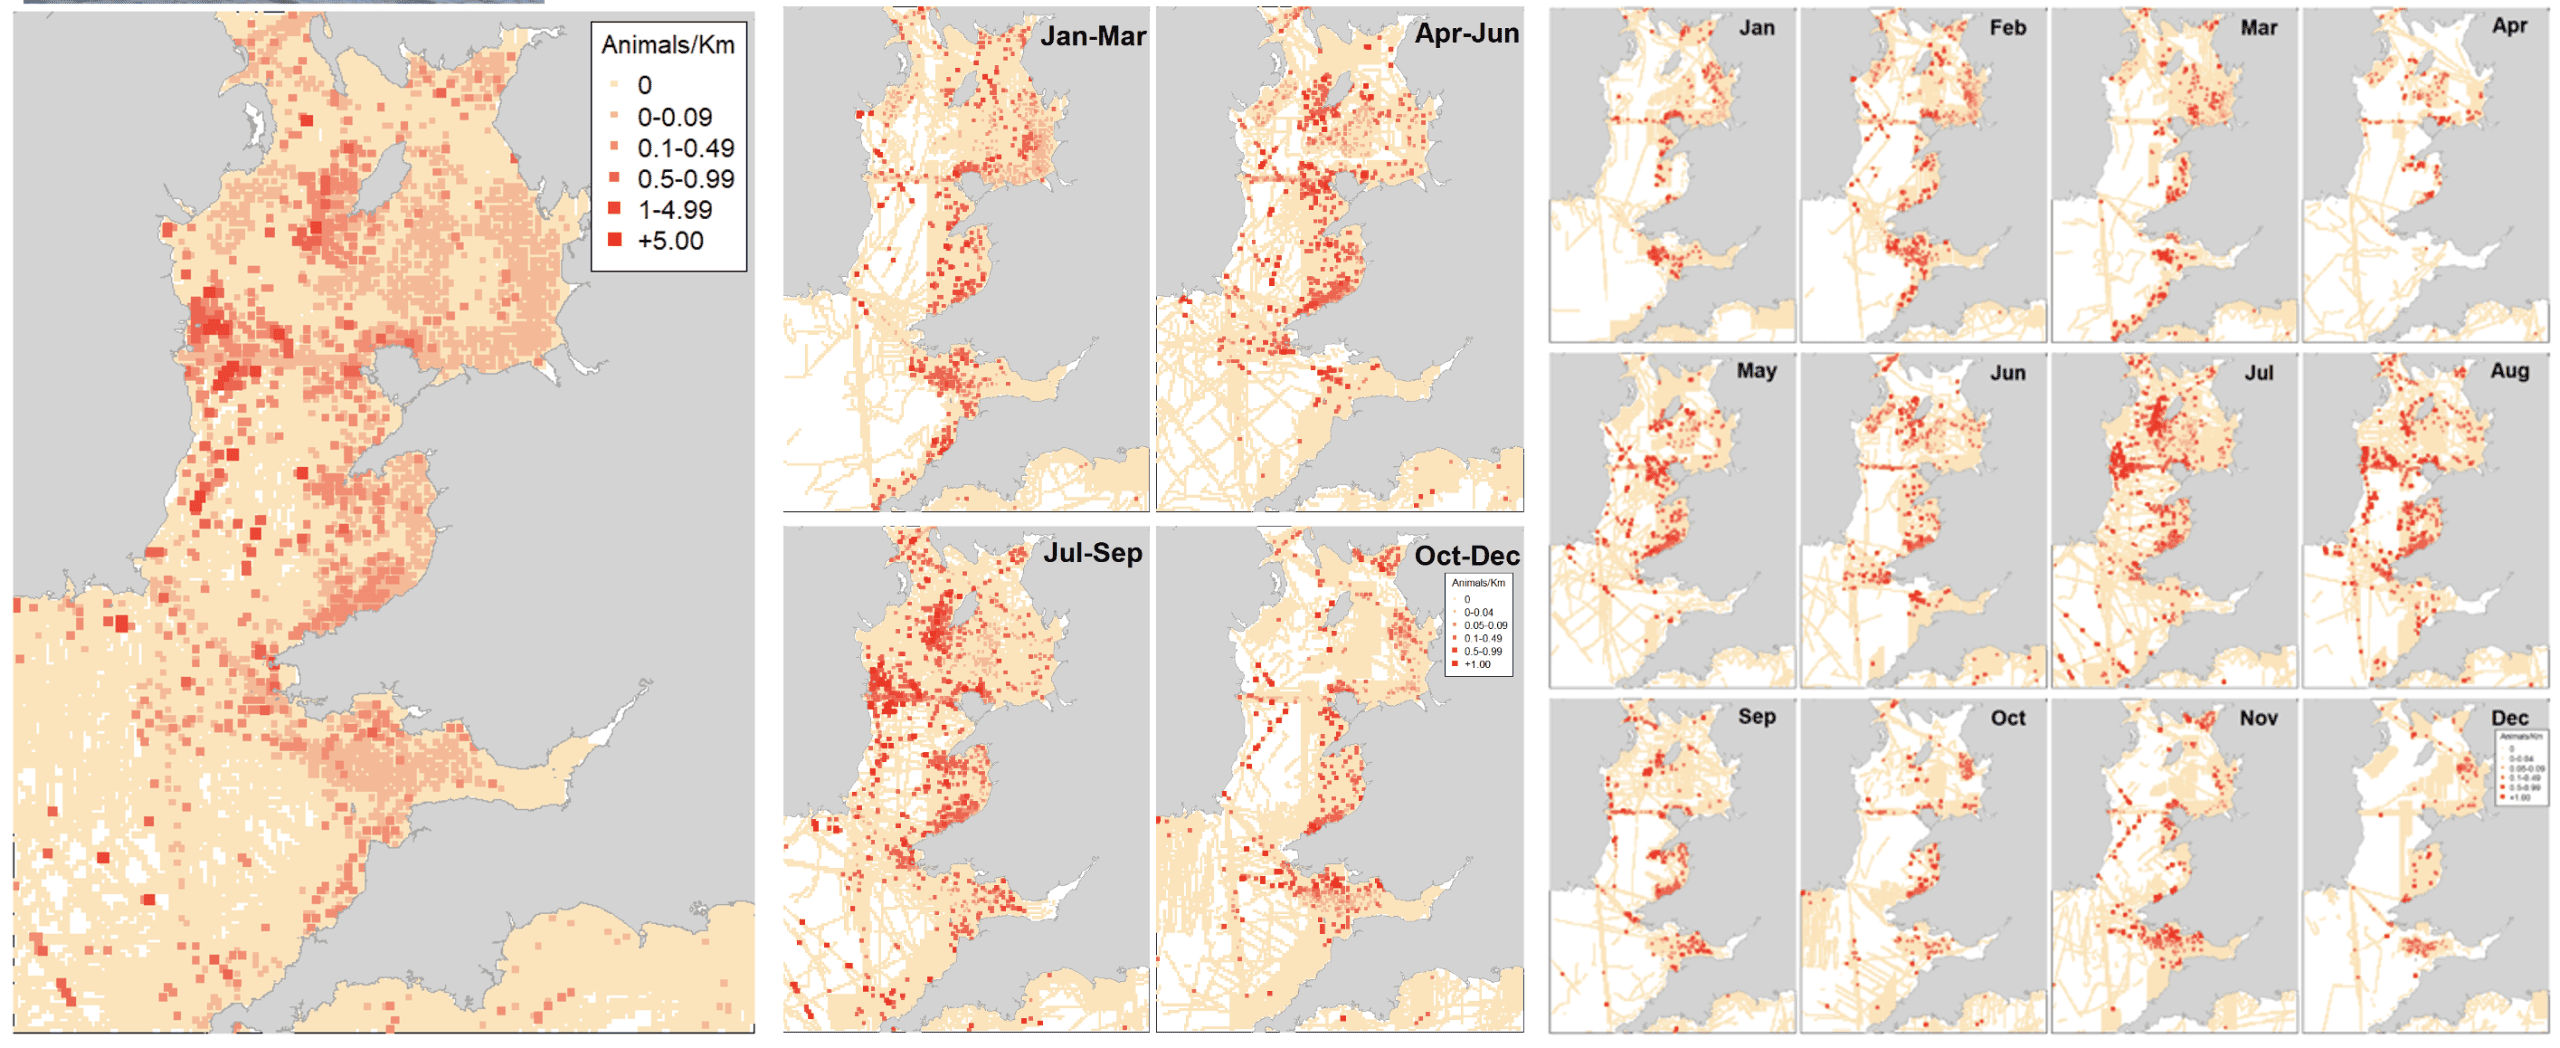
Modelled distributions of cetaceans in the Irish Sea.
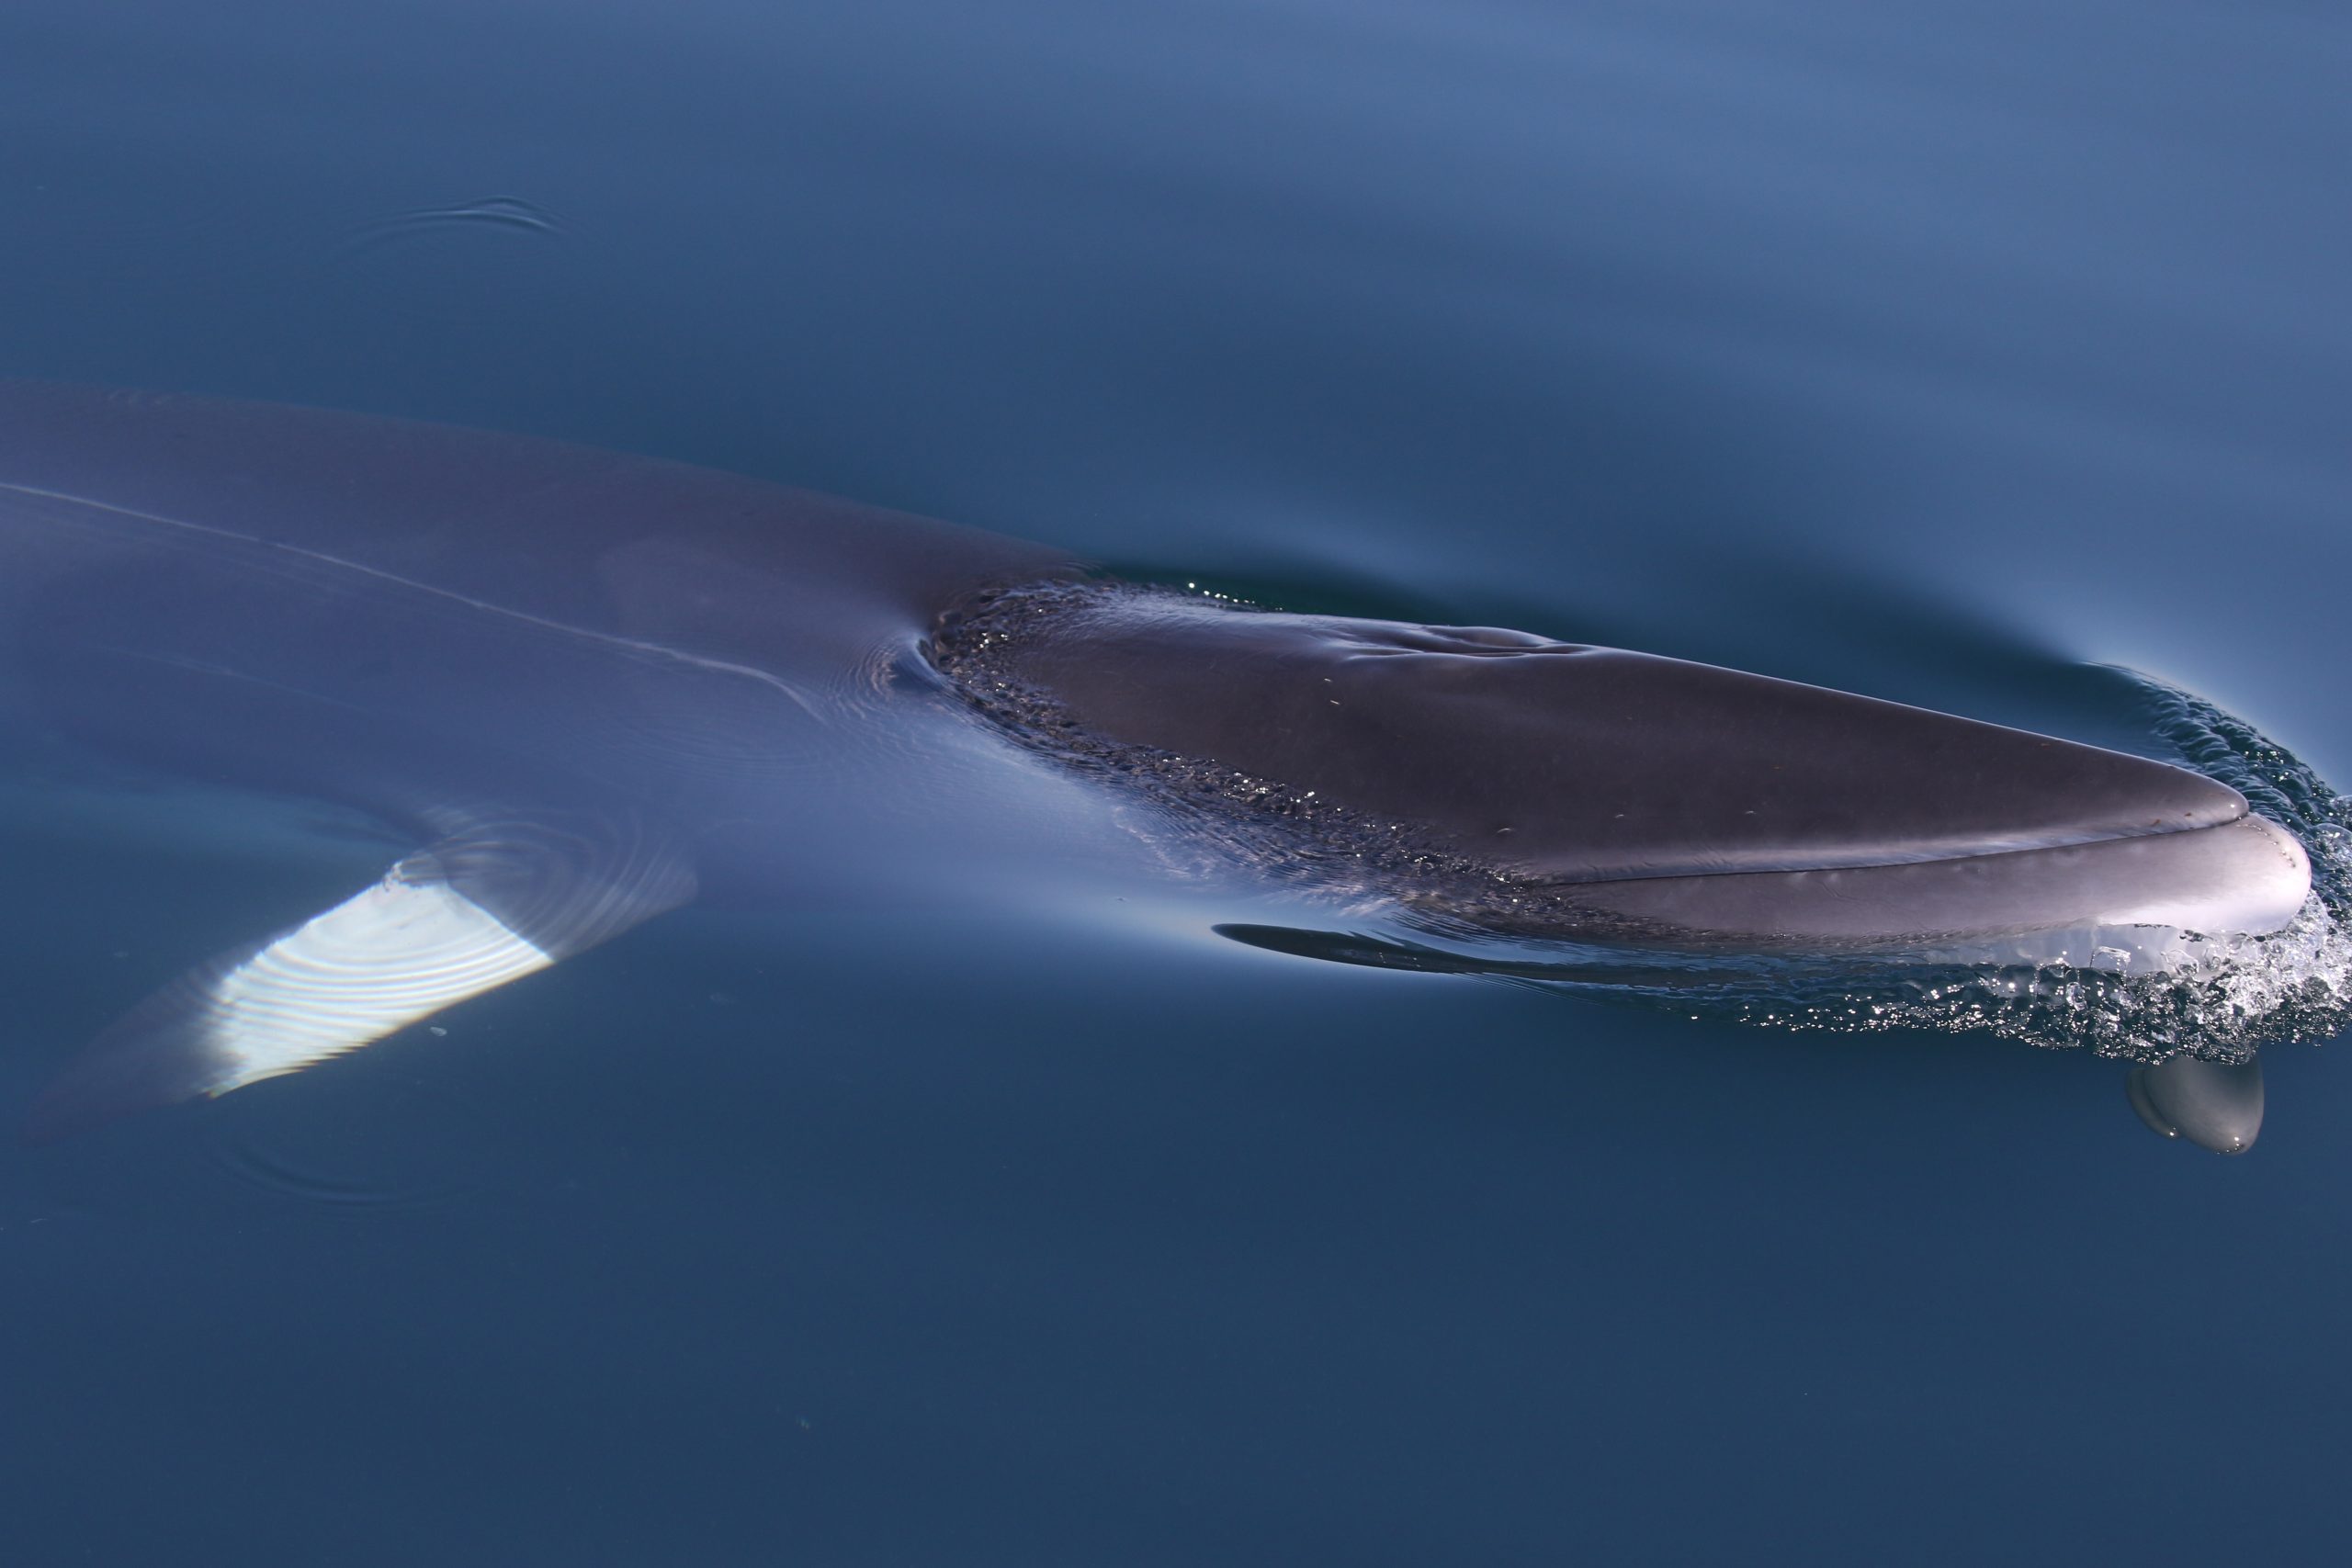
Minke whale
Photo credit: K Lohrengel/Sea Watch Foundation
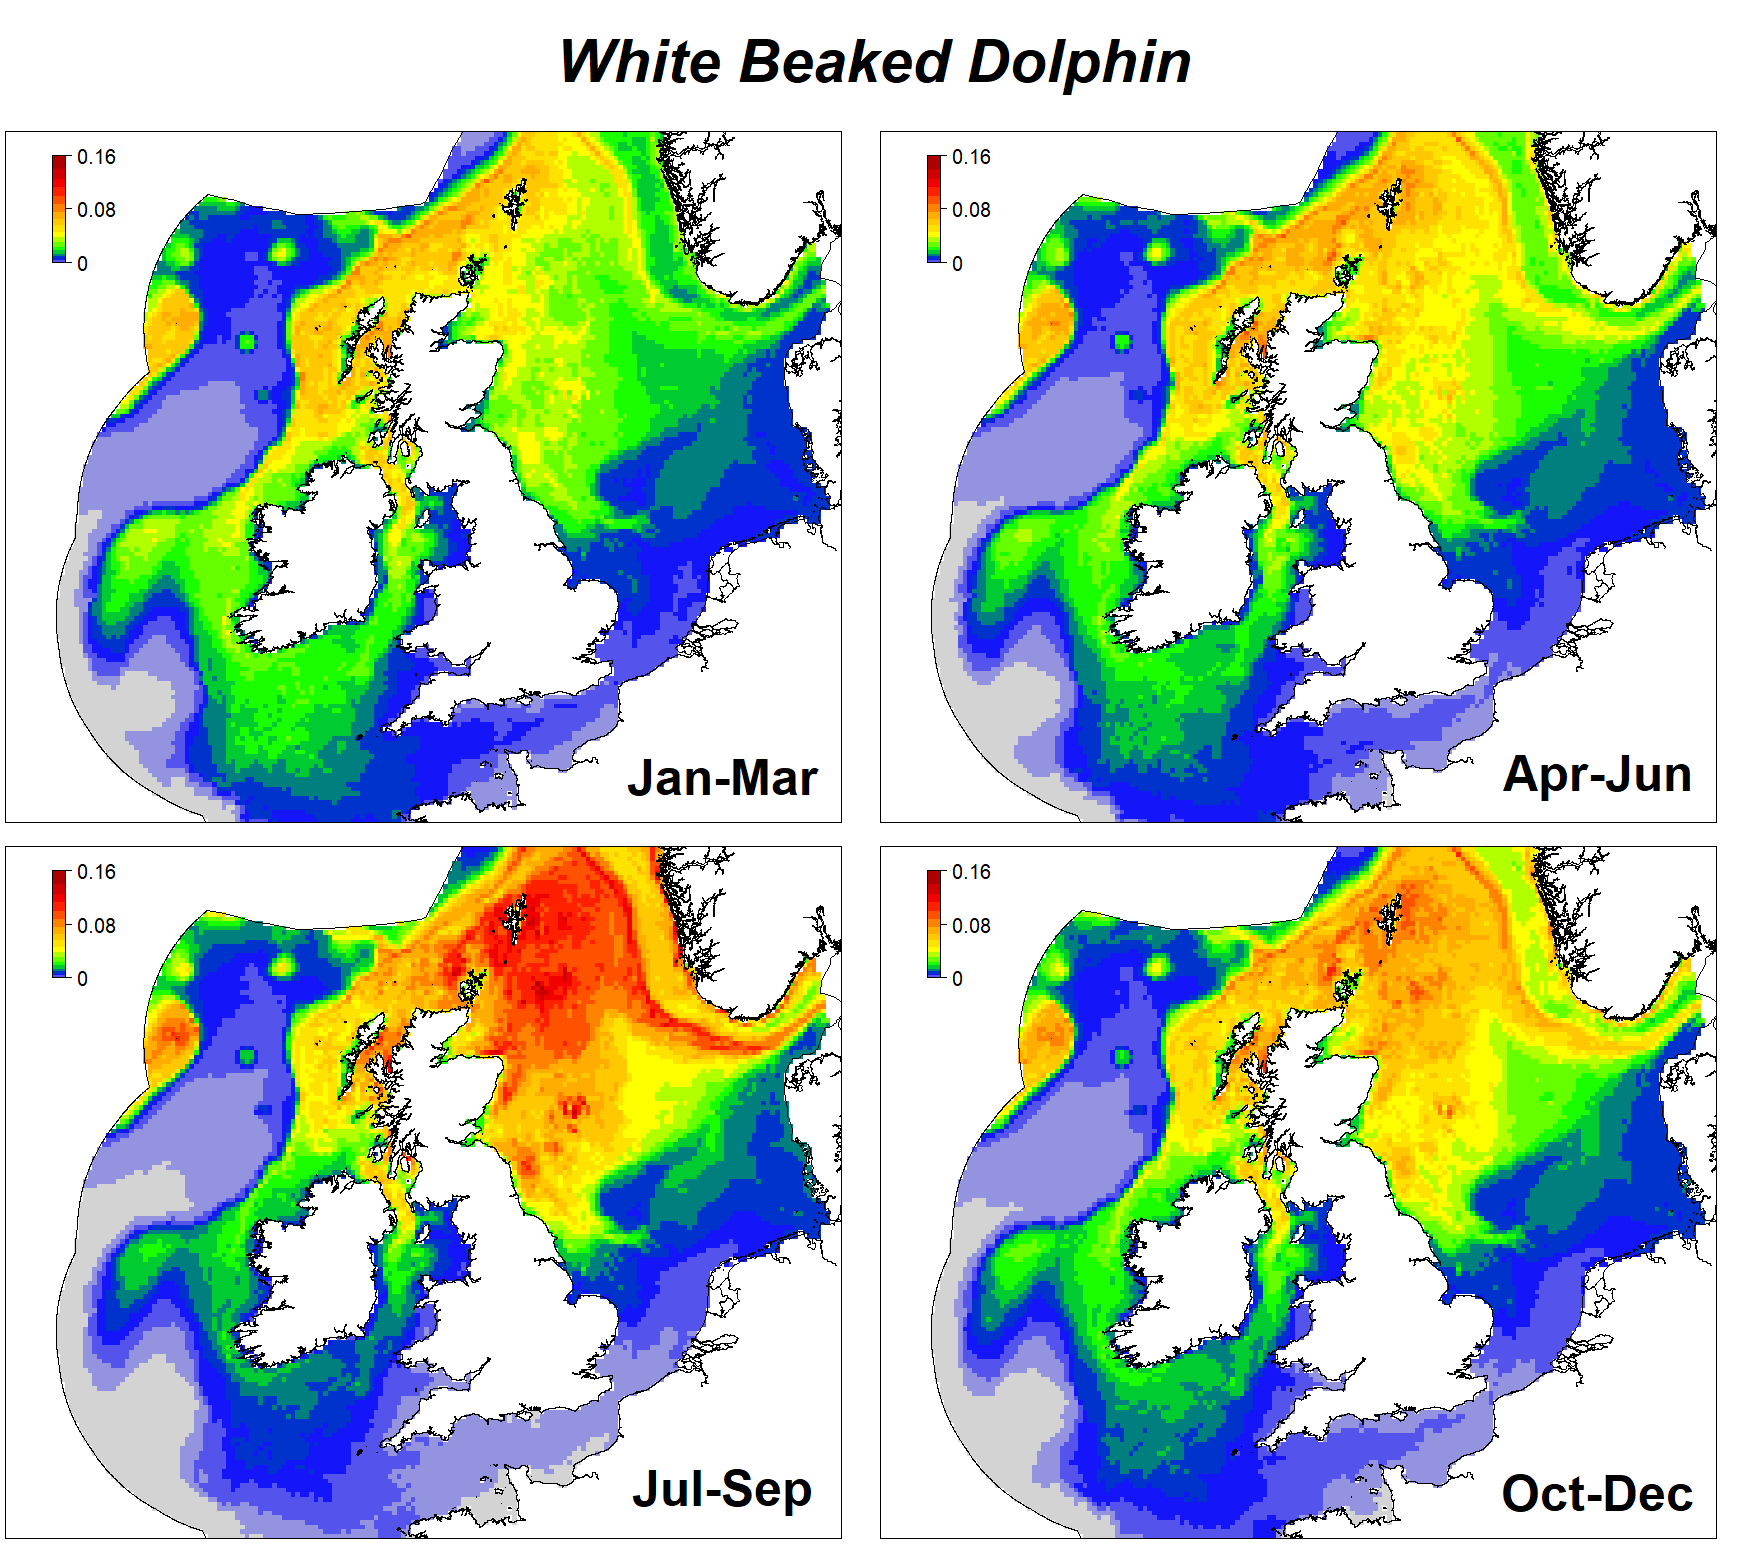
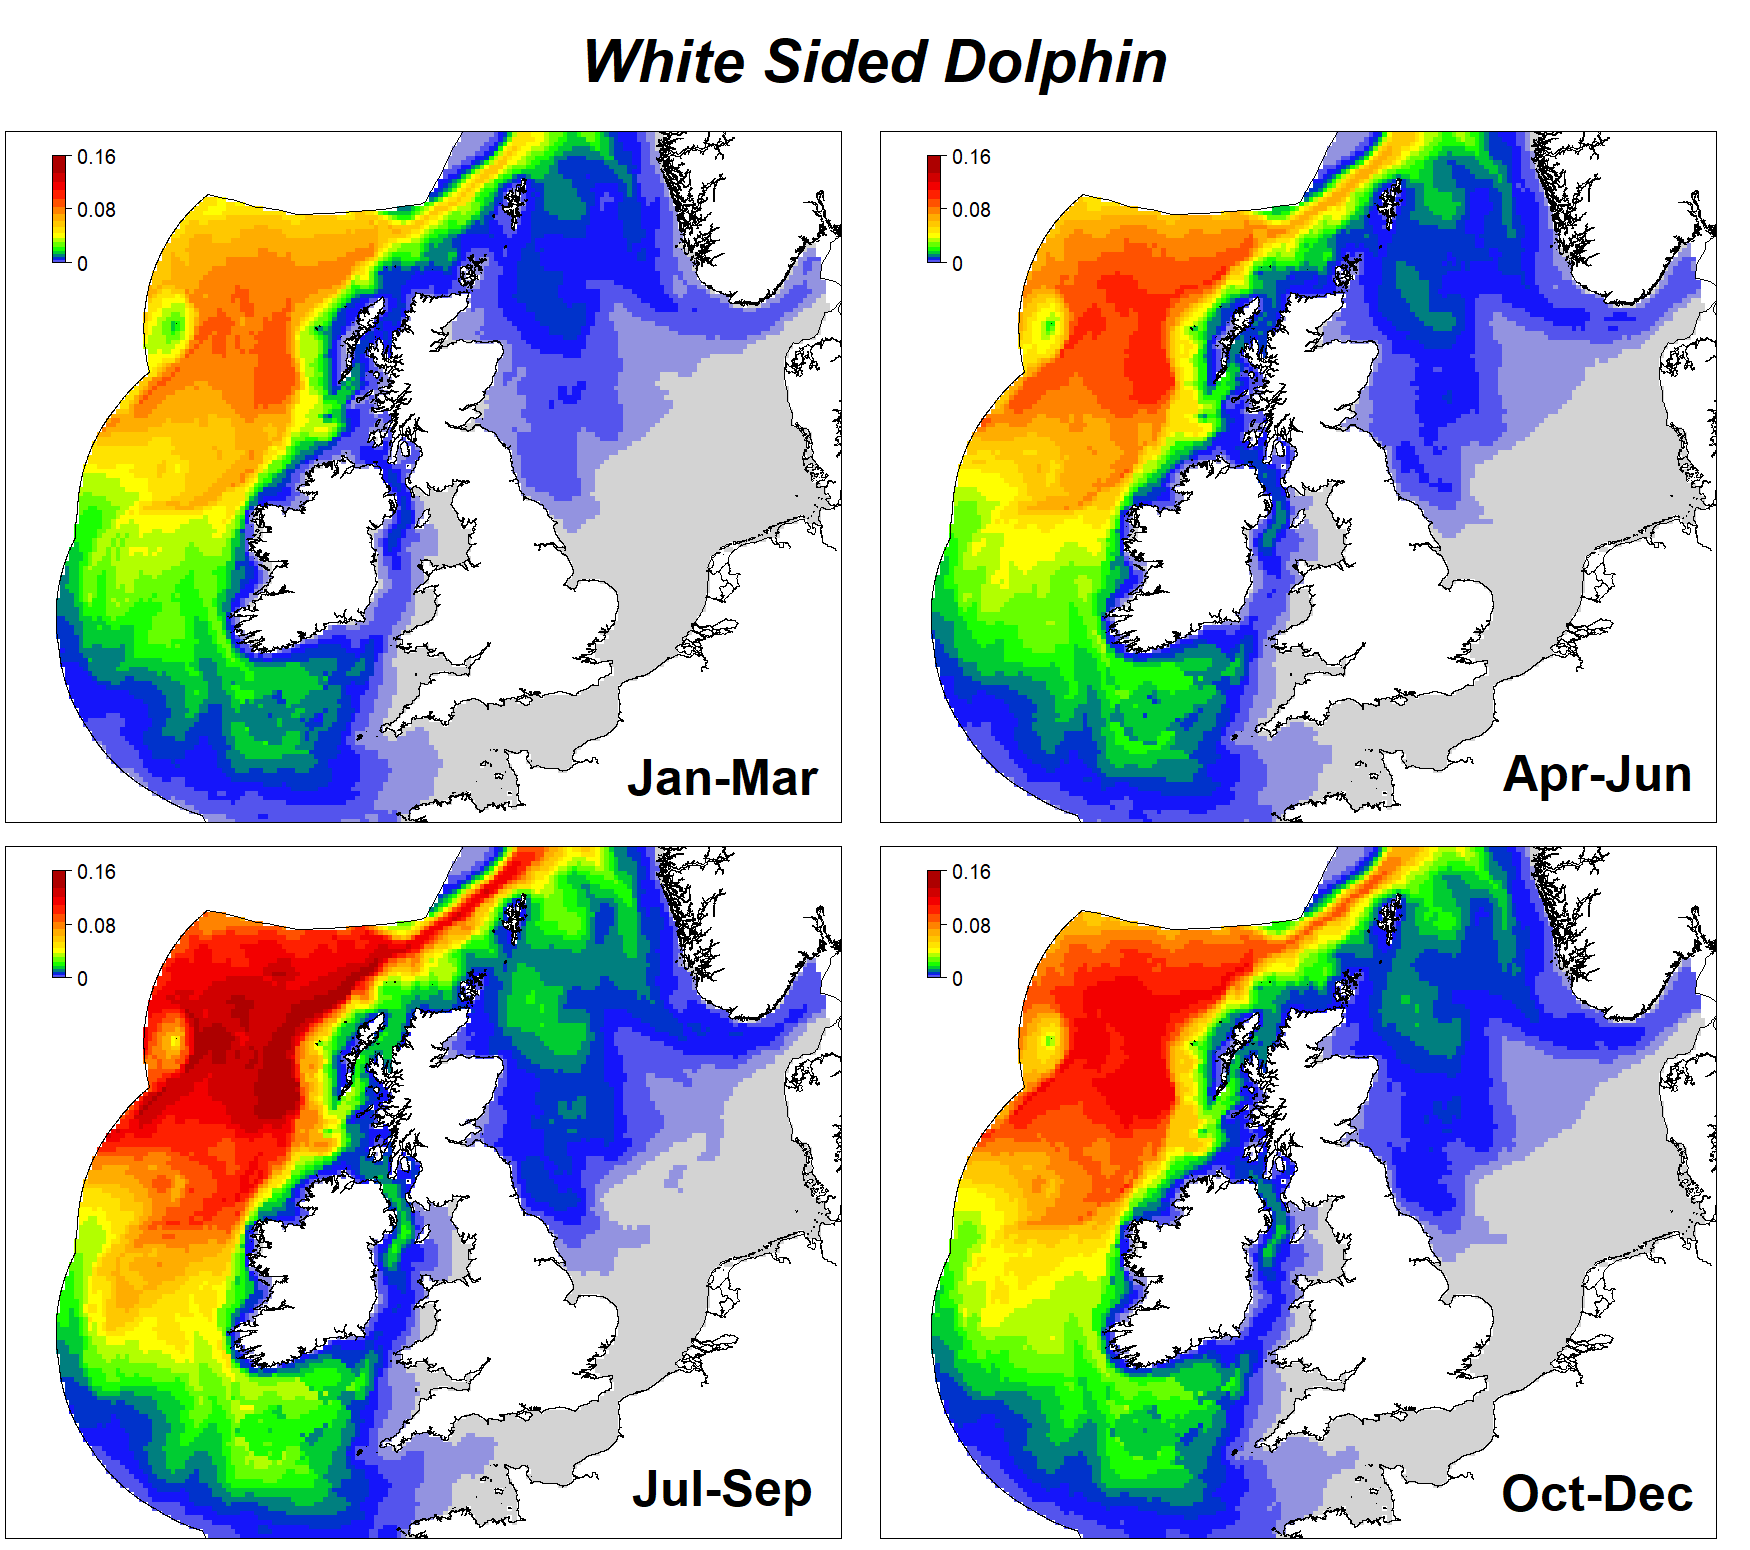
UK quarterly summary of white-beaked dolphin distribution.
Click on the species name to see the seasonal distribution maps:
For coastal distributions and maps of rarer species, it is better to consult the sightings plots in the Atlas of British Mammals (2020), available HERE.
Map interpretation
In order to best understand the distributions of different cetacean species, we rely upon dedicated at-sea surveys. These may be undertaken by vessel or by plane, and can be from human observers or from digital cameras. No survey method is fool-proof. Planes travel through areas much faster than vessels so the time for detecting animals is much shorter. Even the speeds at which vessels travel can vary a lot. Sea conditions and visibility also affect one’s ability to detect cetaceans. Rougher sea conditions make it much more difficult to spot animals when they surface, and the distance over which one can spot them becomes much shorter. Some animals may be missed by observers when they come to the surface (which we call perception bias), whilst obviously when animals are diving below the surface, observers will miss them entirely (called availability bias).
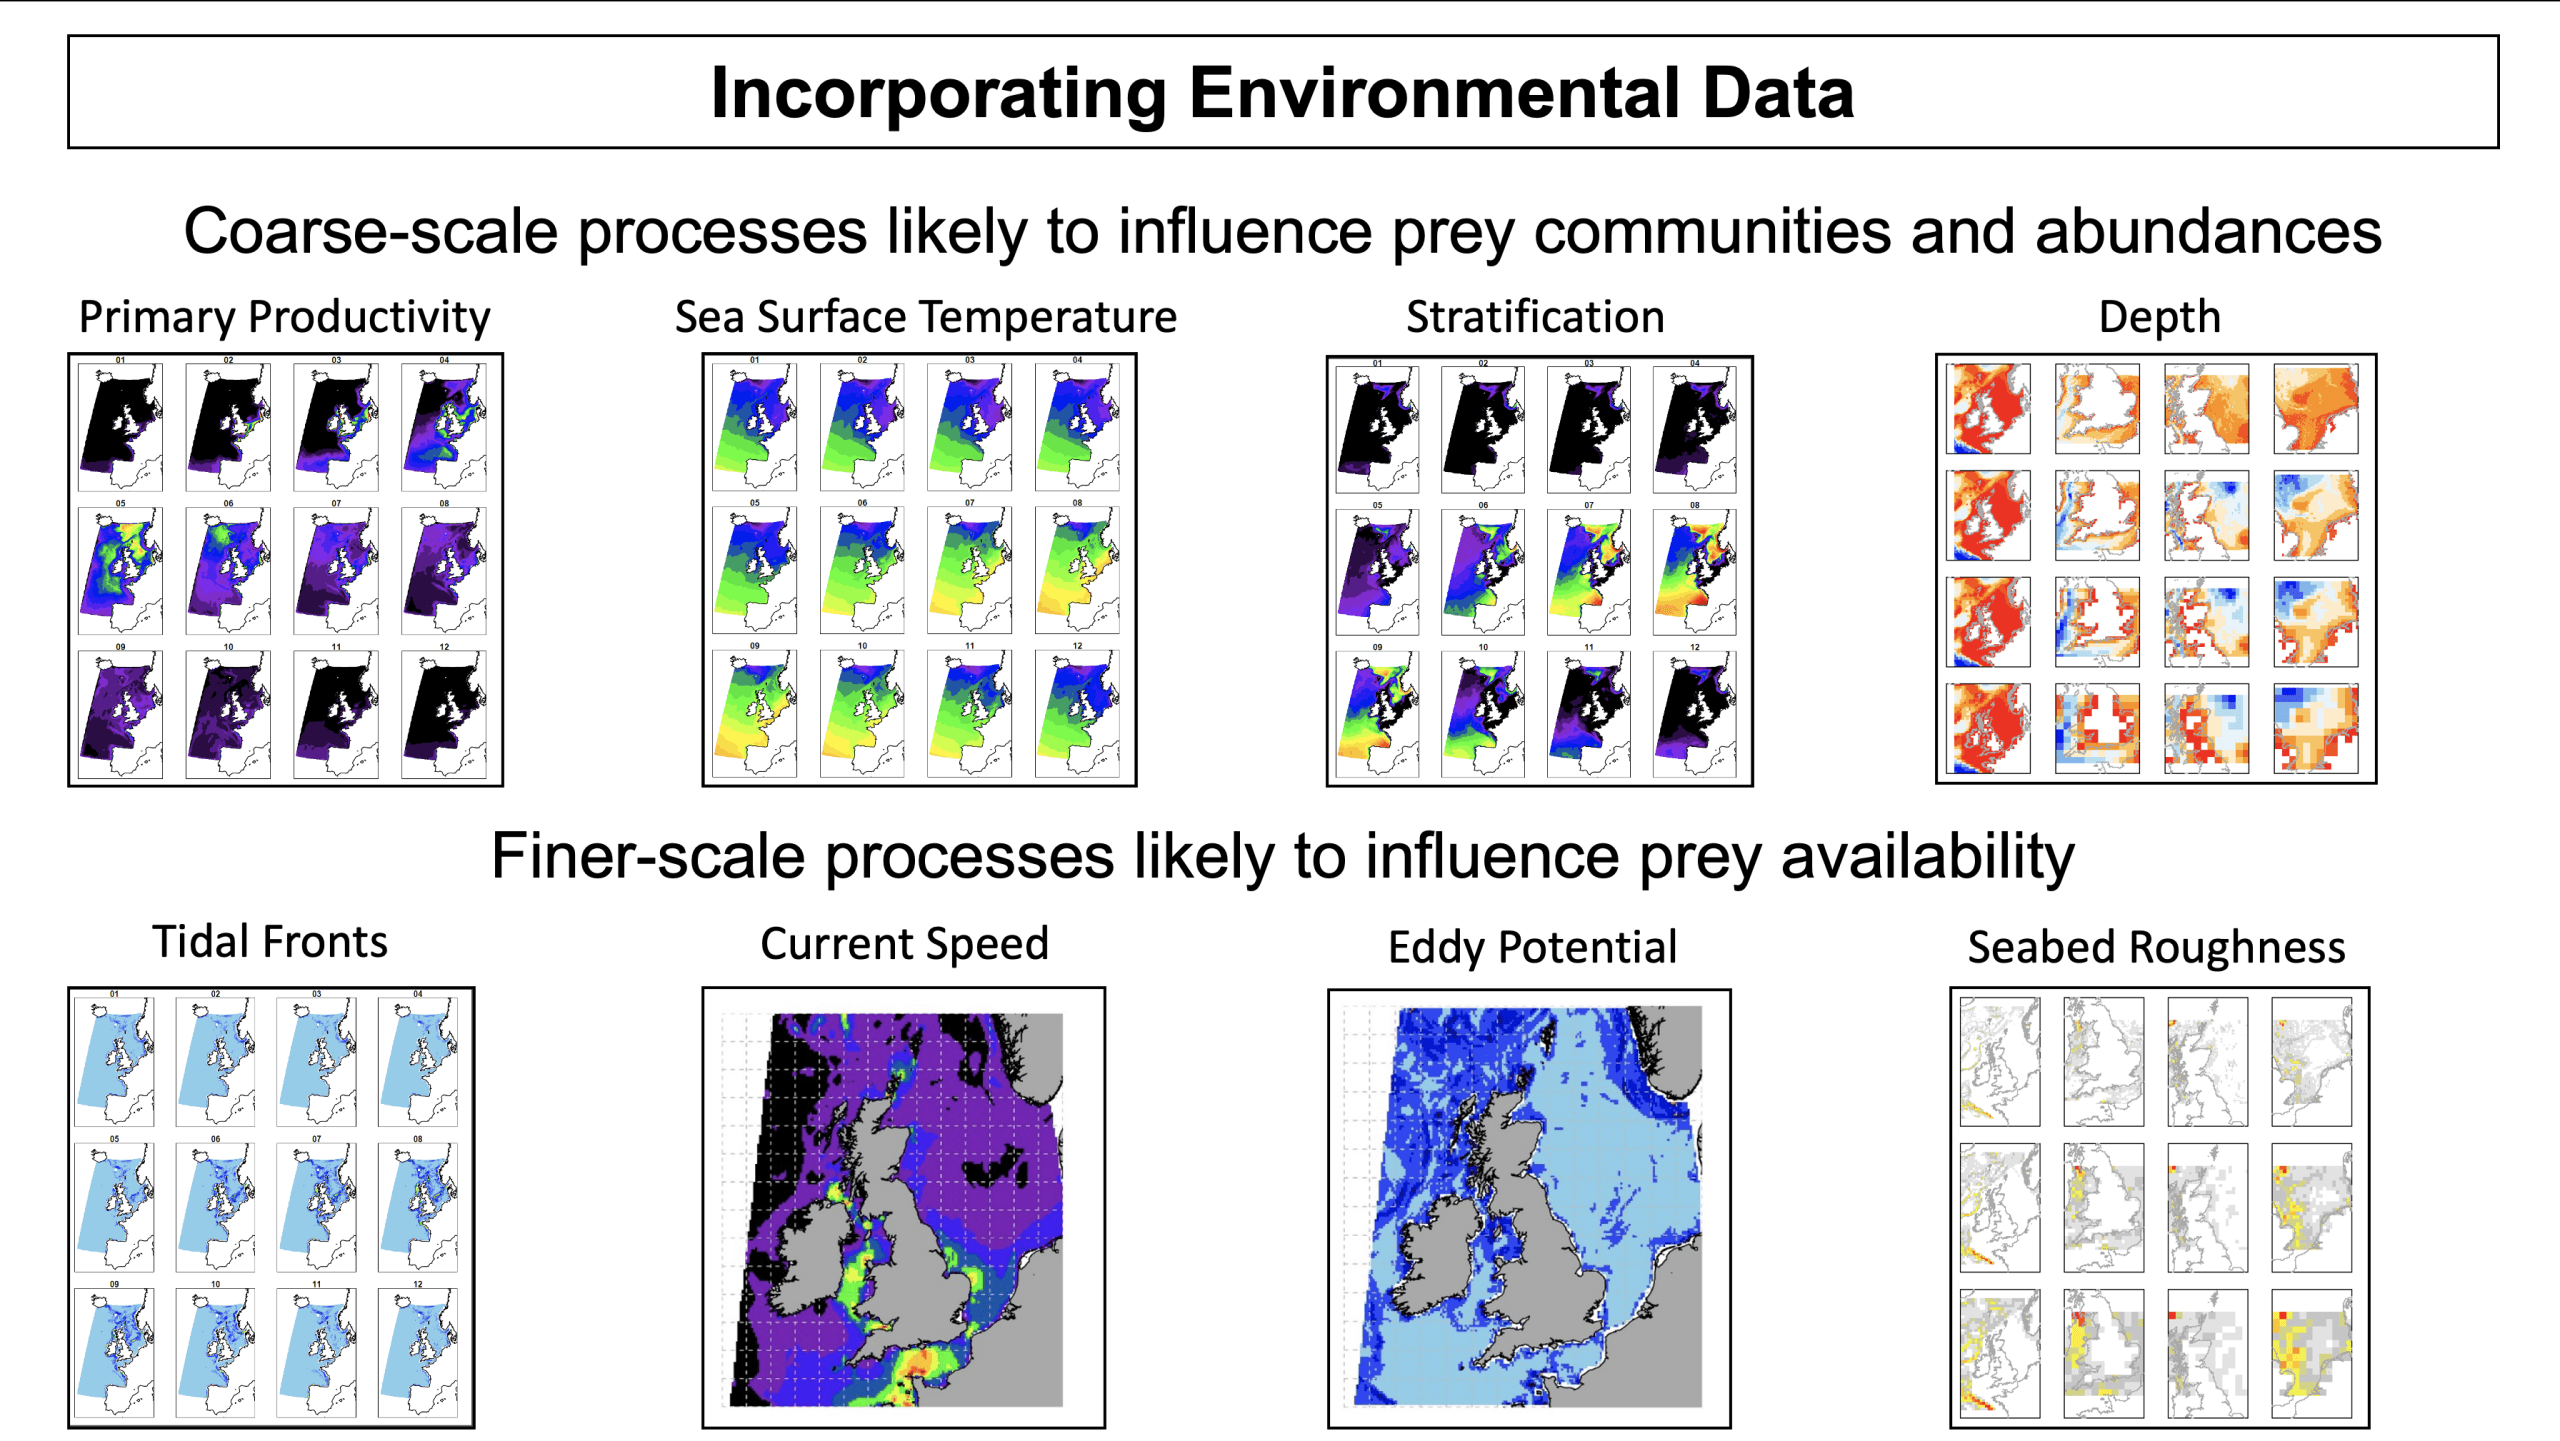
Incorporating environmental data into prey patterns.
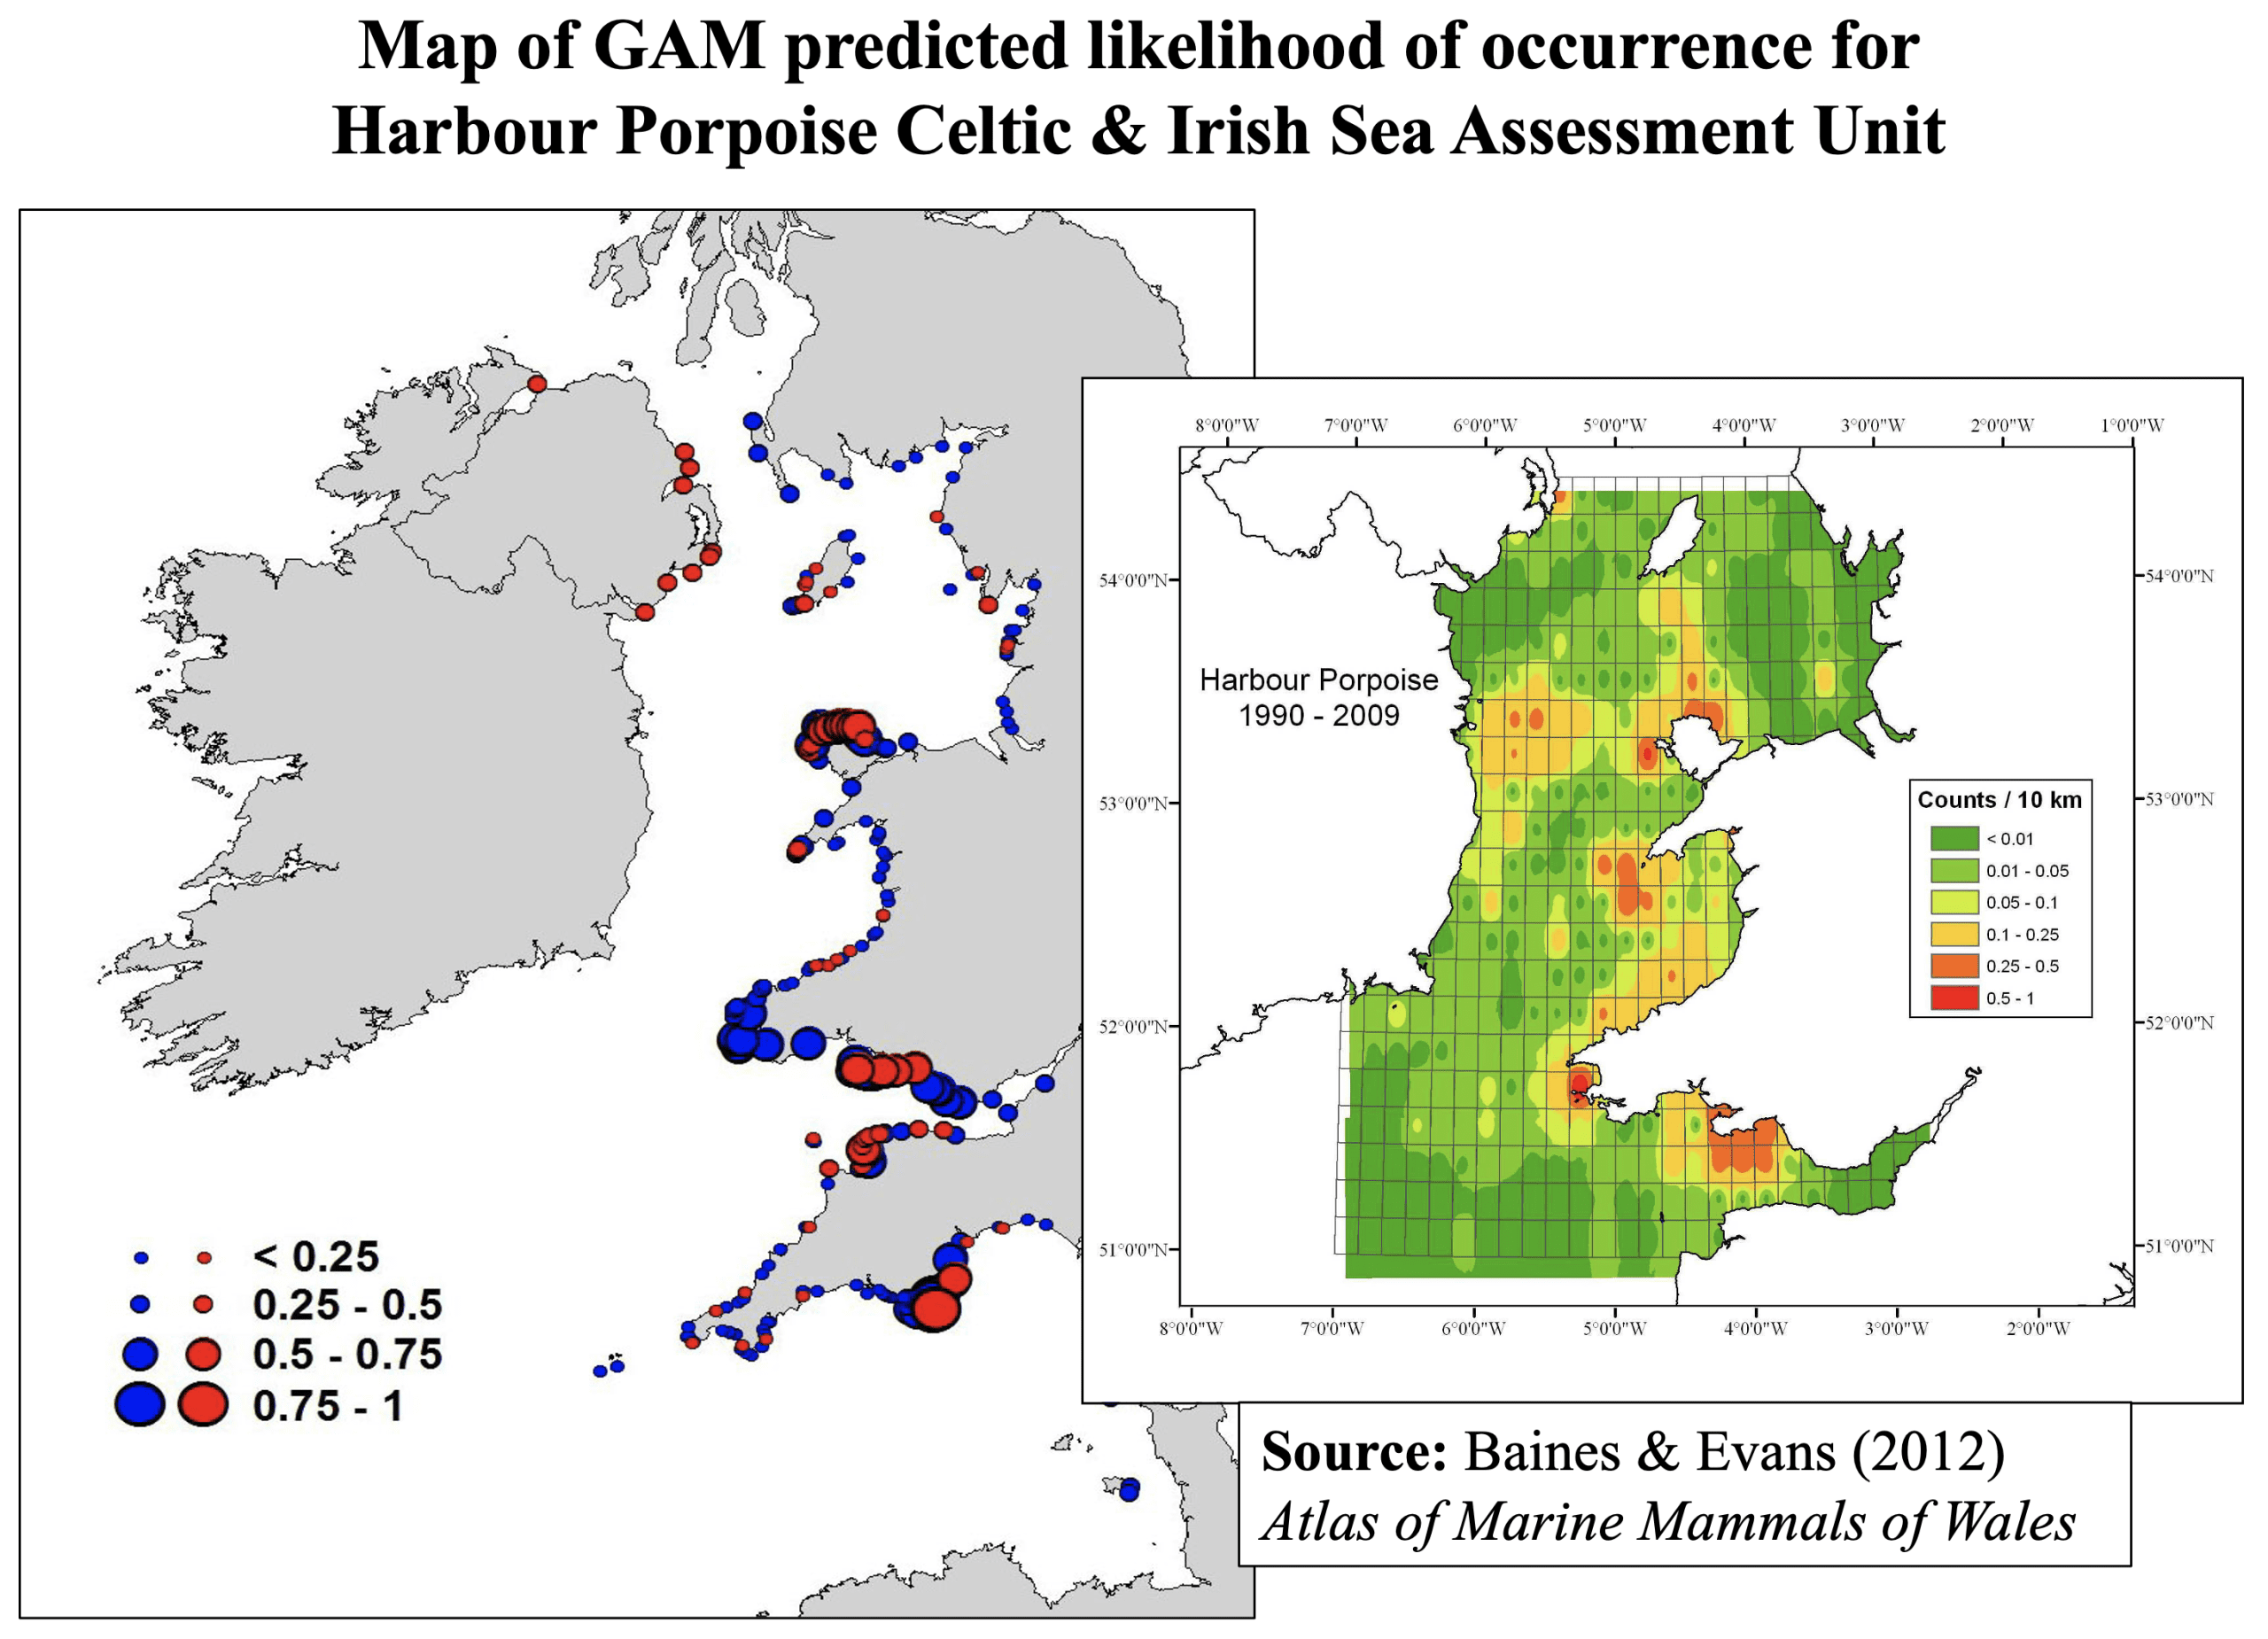
Harbour porpoise sightings in the Irish Sea.
Harbour porpoise modelled densities in the Irish Sea.
Cetaceans spend most of their lives underwater, and surveys, whether by vessel or plane, can do little more than provide a snapshot of their presence whilst some areas may not be sampled at all. For this reason, we try to fill in the gaps by using mathematical models to predict what their densities will be in those under- or un-sampled areas. We do this by attempting to determine their habitat preferences by incorporating into those models a wide range of environmental characteristics, such as water depth, seabed type, sea temperatures, salinity, and various oceanographic features that reflect concentrations of plankton, fish and other marine life upon which cetaceans prey.
For all these reasons, we try to find ways to account for those limitations so we can get as accurate an estimate of the densities and therefore abundance of the different species and how this varies geographically, between seasons and across years.
Using sightings data to determine changes in range and abundance
In 2003, Sea Watch teamed up with the Sea Mammal Research Unit (at Andrews University) and Joint Nature Conservation Committee to produce an Atlas of Cetacean Distribution in North-west European Waters (Reid et al., 2003). Since then, many new data relating to cetacean distribution have been collected. The European Seabirds at Sea and Sea Watch databases have been augmented by data from opportunistic, generic surveys, as well as systematic, geographically targeted ones. The SCANS (Small Cetacean Abundance in the North Sea and adjacent waters) survey first undertaken in July 1994, was repeated over a more extensive area in 2005 (SCANS-II), and survey coverage was further extended by the 2007 CODA (Cetacean Offshore Distribution Abundance) survey. The entire region was further surveyed in July 2016 (SCANS-III), and repeated again with more intensive coverage, mainly by aerial survey, in summer 2022 (SCANS-IV). In addition to these, other data sets from both Britain and continental Europe now exist and have enhanced our knowledge, particularly in other seasons and between the less frequent large-scale surveys. These include regional surveys in relation to environmental impact assessments of offshore energy developments, and monitoring of populations within marine protected areas, and specific areas.
Sightings trends off the Yorkshire coast.
In 2009, an Atlas of Marine Mammals of Wales (Baines and Evans 2009) was commissioned by Countryside Council for Wales to meet requirements for information on marine mammal distribution and abundance in Welsh waters. This supported environmental stewardship and helped to determine appropriate mitigation measures in order to avoid or minimise impacts for future sustainable management. This was subsequently expanded and revised three years later (Baines and Evans 2012). Those Atlases followed the methodology of the earlier Atlas of Cetacean Distribution in North-west European Waters (Reid et al. 2003), and mapped species distributions as standardised numbers per hour of observation. In the revised version (Baines and Evans 2012), data were presented from both aerial and vessel surveys, and distributions mapped as standardised numbers of animals per km surveyed. Subsequently, analytical methods were developed further, with density distributions calculated from sighting rates, measurements of effective strip widths, estimated probabilities of detection, and modelling. Similar attempts to combine data from a wide variety of types of surveys were made by Paxton et al. (2016) under the Joint Cetacean Protocol (JCP) established by the UK’s Joint Nature Conservation Committee (JNCC), for which Sea Watch Foundation was a Steering Group member. The aim of that study was to determine how a diversity of data types might be integrated and what power the final data resources might have to detect trends in range and abundance. Recently, the JCP has developed into the JCDP, Joint Cetacean Data Programme, and is hosted by ICES (the International Council for the Exploration of the Sea). This initiative from JNCC encourages submissions from holders of survey datasets, whether from universities, research groups or NGOs. The first datasets incorporated have come largely from our UK-based compatriots, ORCA with data collected from ferries and cruise ships, and HWDT (Hebridean Whale & Dolphin Trust based in West Scotland) as well as ourselves.
Harbour porpoise distribution changes in the North Sea from 1988-2017.
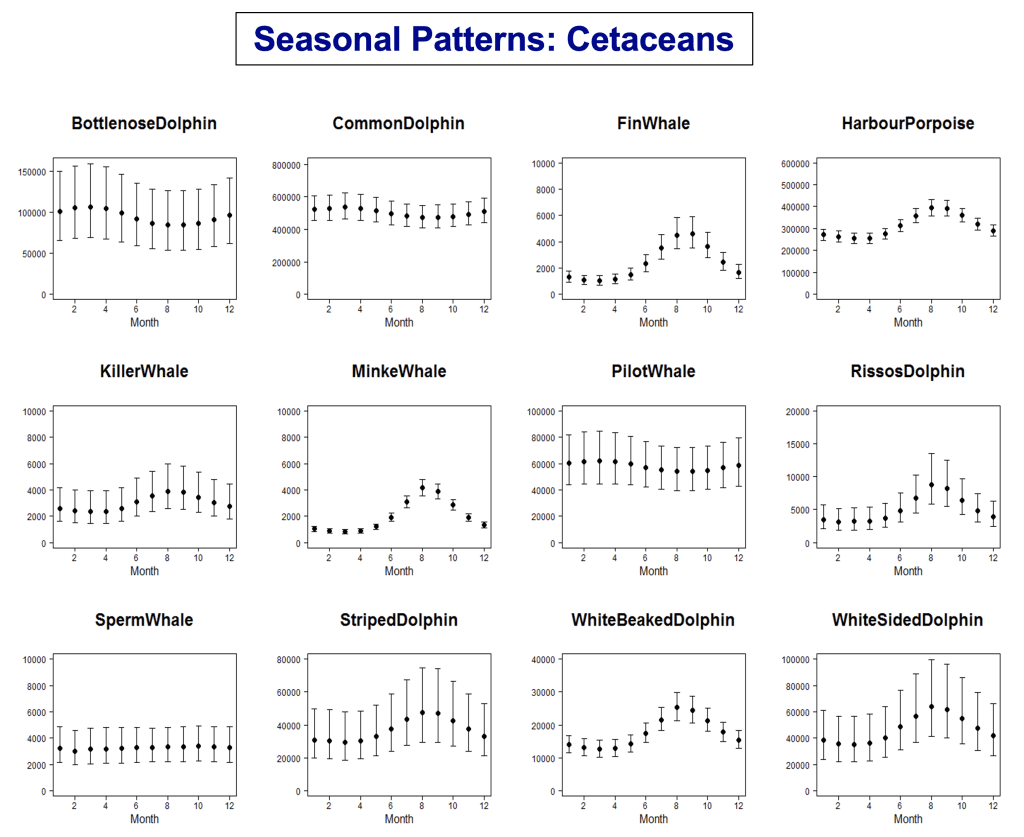
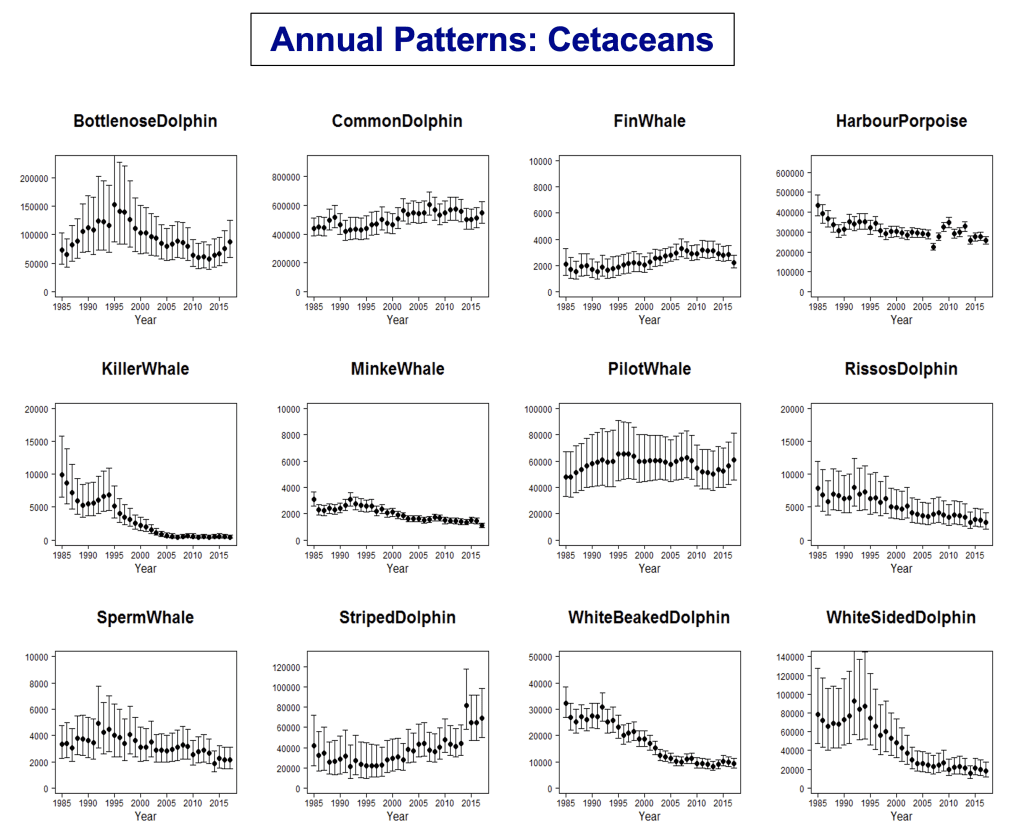
A five-year research programme called the Marine Ecosystems Research Programme (MERP) involving many research institutions was initiated in 2014 with funding from the UK Natural Environment Research Council and Defra. Sea Watch Foundation was a partner in this programme, leading on developing distribution maps for cetaceans and seabirds throughout NW European Seas, in collaboration with Bangor University. A new regional Atlas of Modelled Distributions of Cetaceans and Seabirds of Wales and Surrounding Waters was commissioned by Natural Resources Wales and published in 2023 (Evans & Waggitt, 2023).
Images: 1) Seasonal cetacean trends in NW Europe; 2) Annual cetacean trends in NW Europe
Nature conservation legislation
There are several national and international instruments that are served by having surveys and monitoring of the abundance and distributions of different cetacean species. Perhaps the most appropriate legal driver is the EU Habitats Directive (HD; EEC 1992). All species of cetacean are included in Annex 4 of the Directive, which places an obligation on all European Union Member States to accord them strict protection. This carries with it the requirement to report on species conservation status every six years. Favourable Conservation Status (FCS) must be assessed with regard to four parameters: natural range, population size, habitat (extent and condition) and future prospects. While some flexibility is accorded to national experts, EC advice recommends the use of time series data to detect change in FCS, possibly in comparison against favourable reference values. Although the UK is no longer within the European Union, it has adopted most of the legislation of the EU Habitats Directive within the Conservation of Habitats and Species Regulations 2017. Furthermore, the UK has signed up to the EU Marine Strategy Framework Directive (MSFD) through its membership of the OSPAR Convention (The Convention for the Protection of the Marine Environment of the North-East Atlantic, 1992), and is a party to ASCOBANS, the Regional Agreement on the Conservation of Small Cetaceans of the Baltic, North-East Atlantic, Irish and North Seas (1992) that is part of the UN Convention on the Conservation of Migratory Species of Wild Animals (CMS).
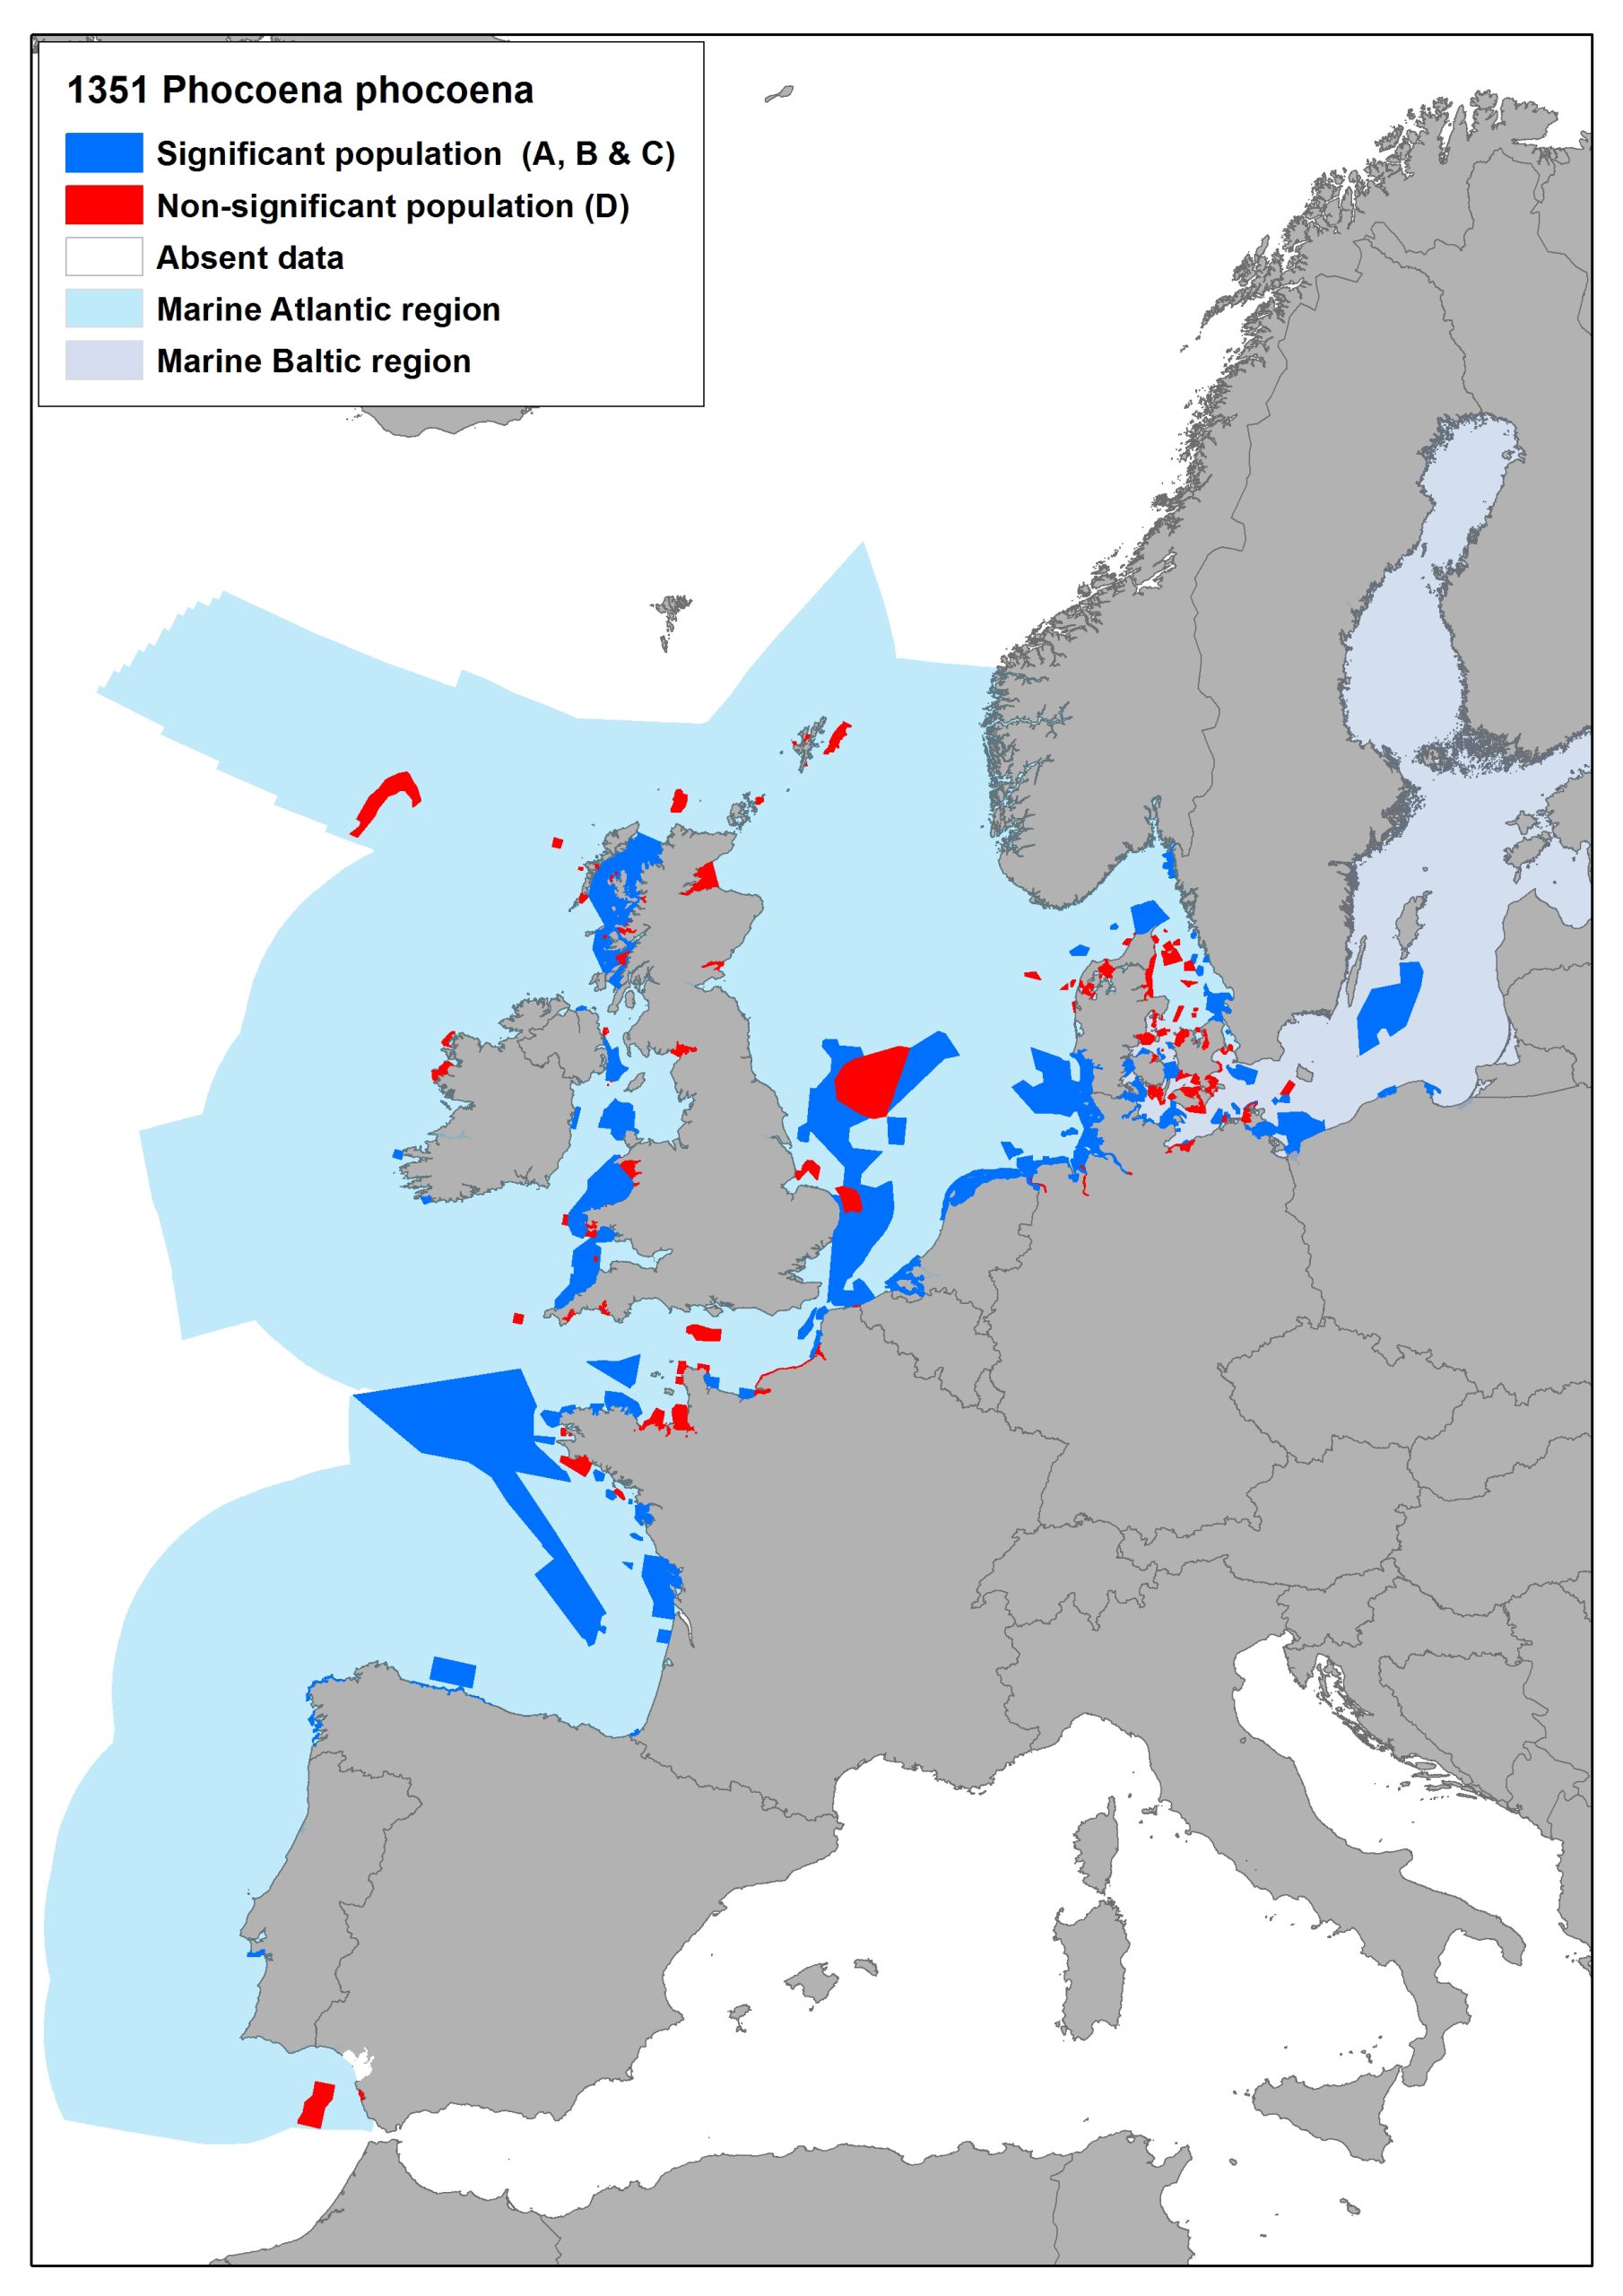
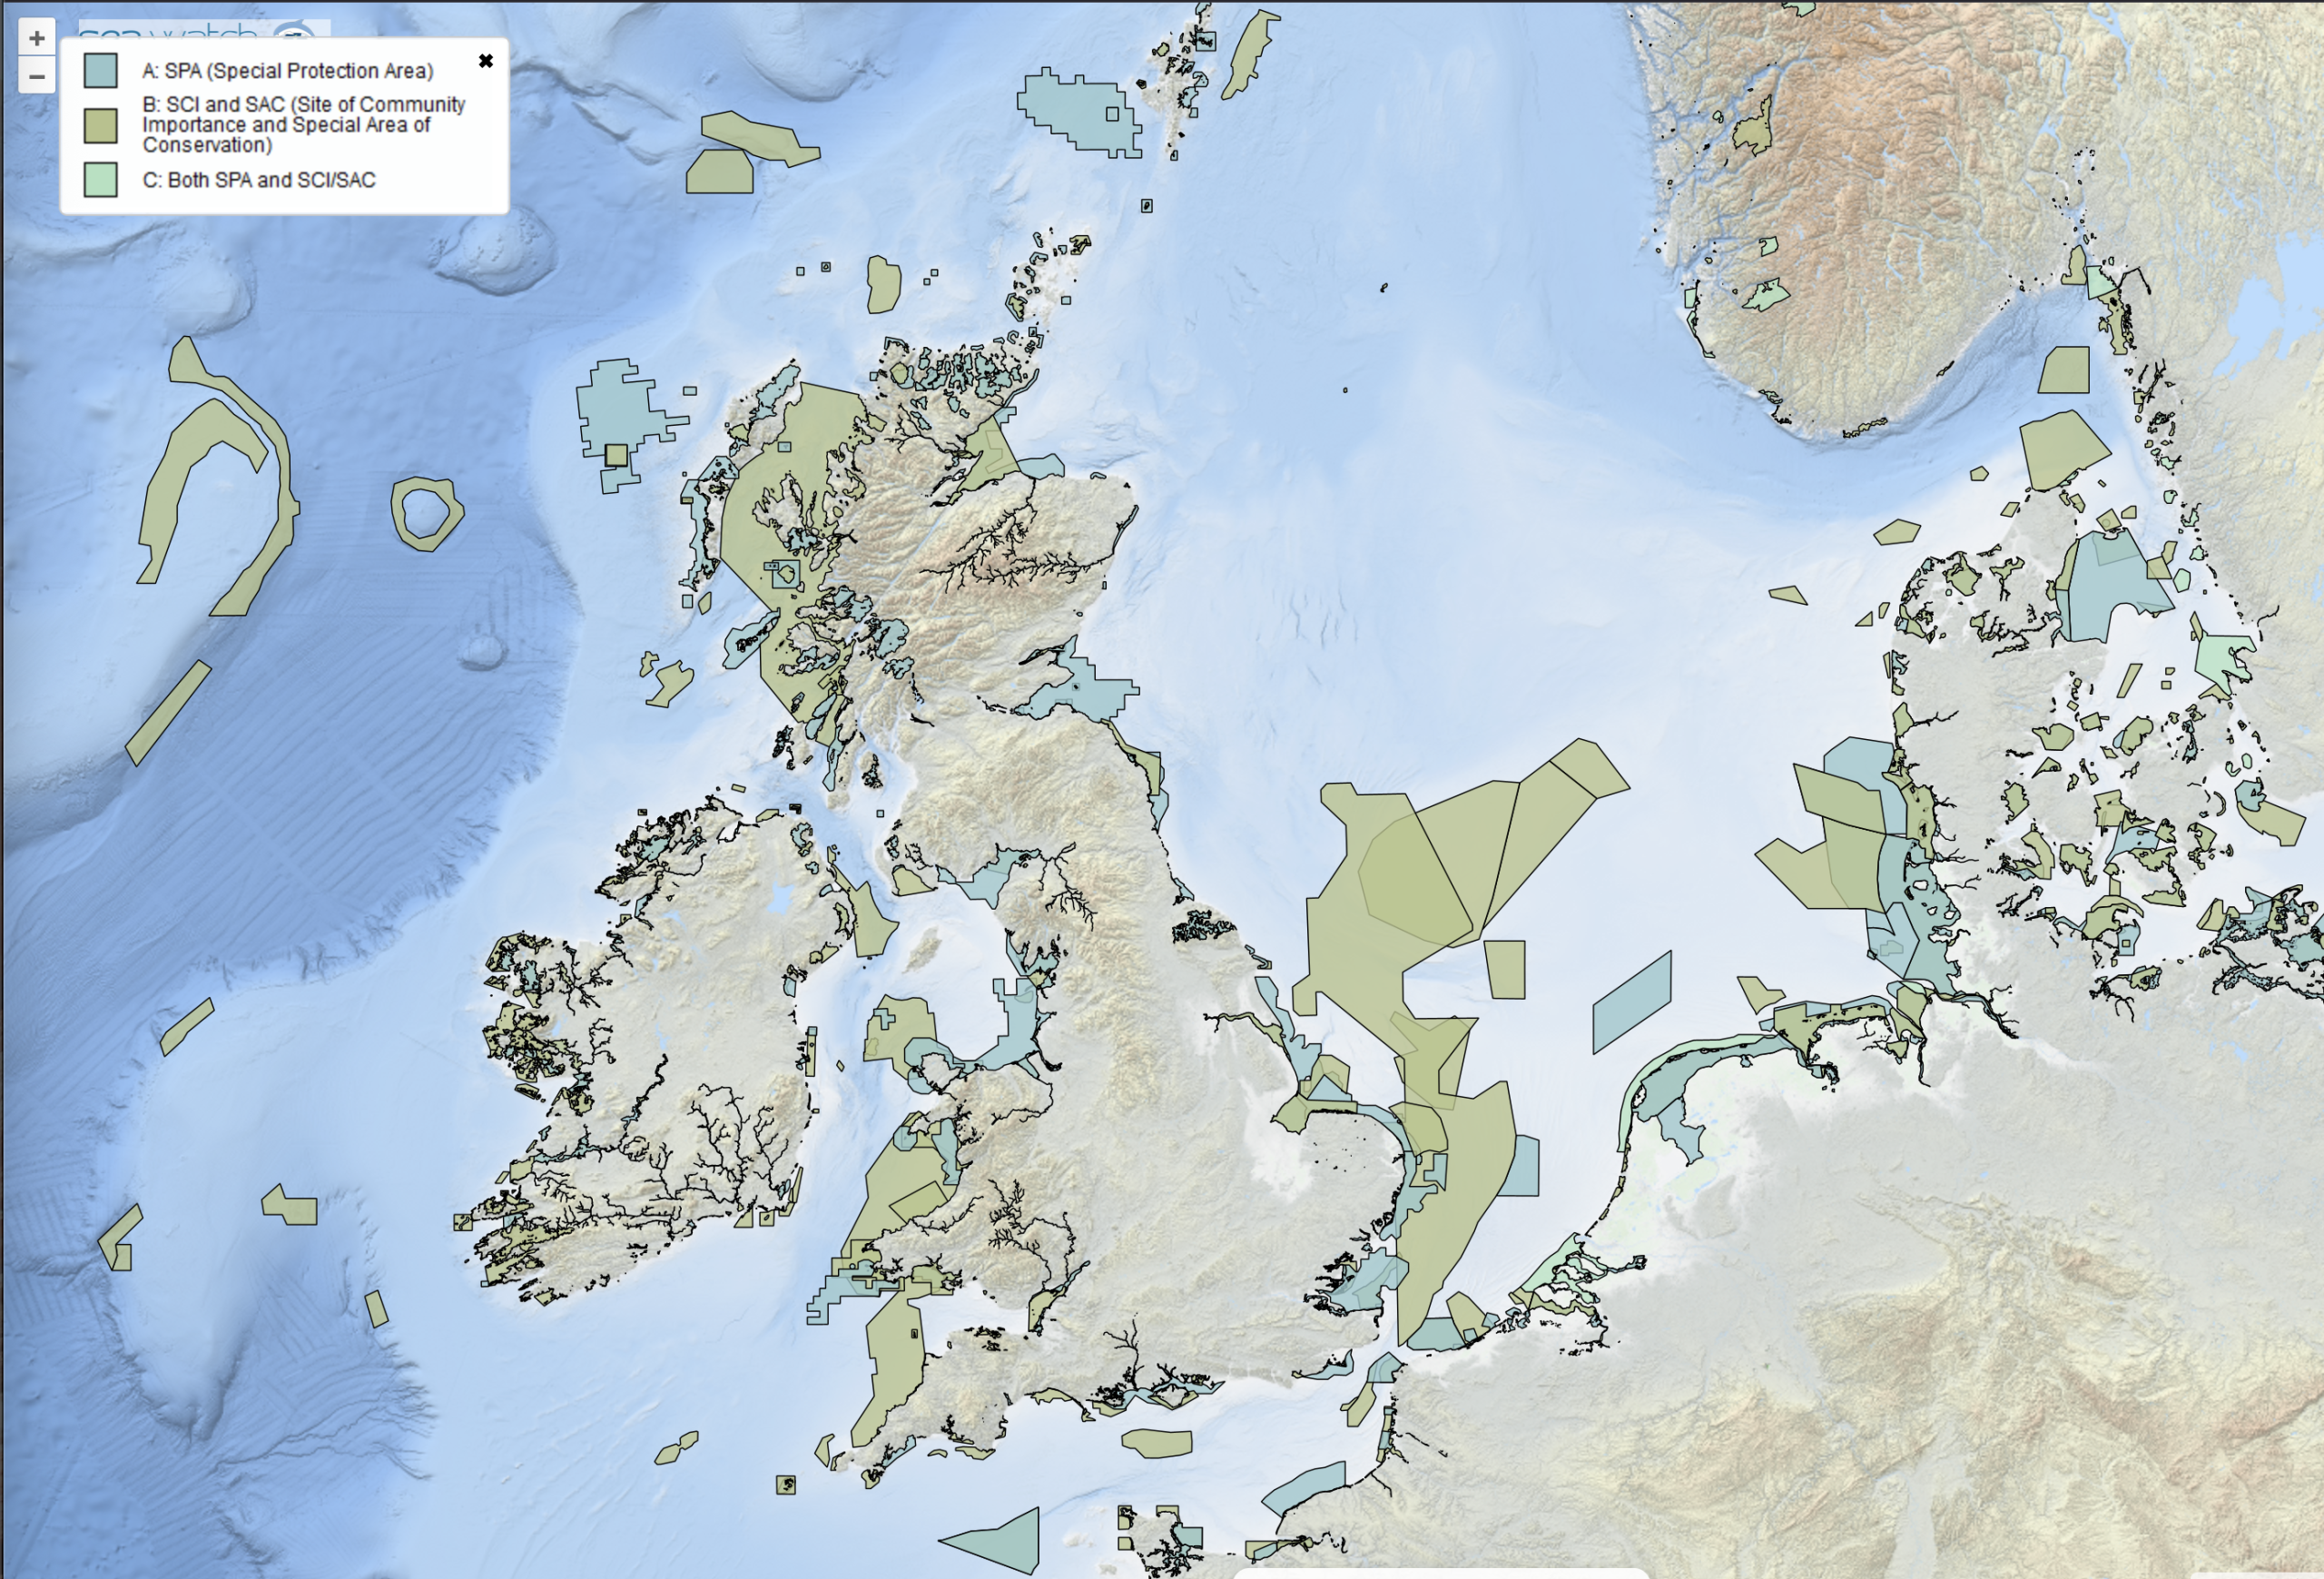
Harbour porpoise dedicated Special Areas of Conservation (SACs).
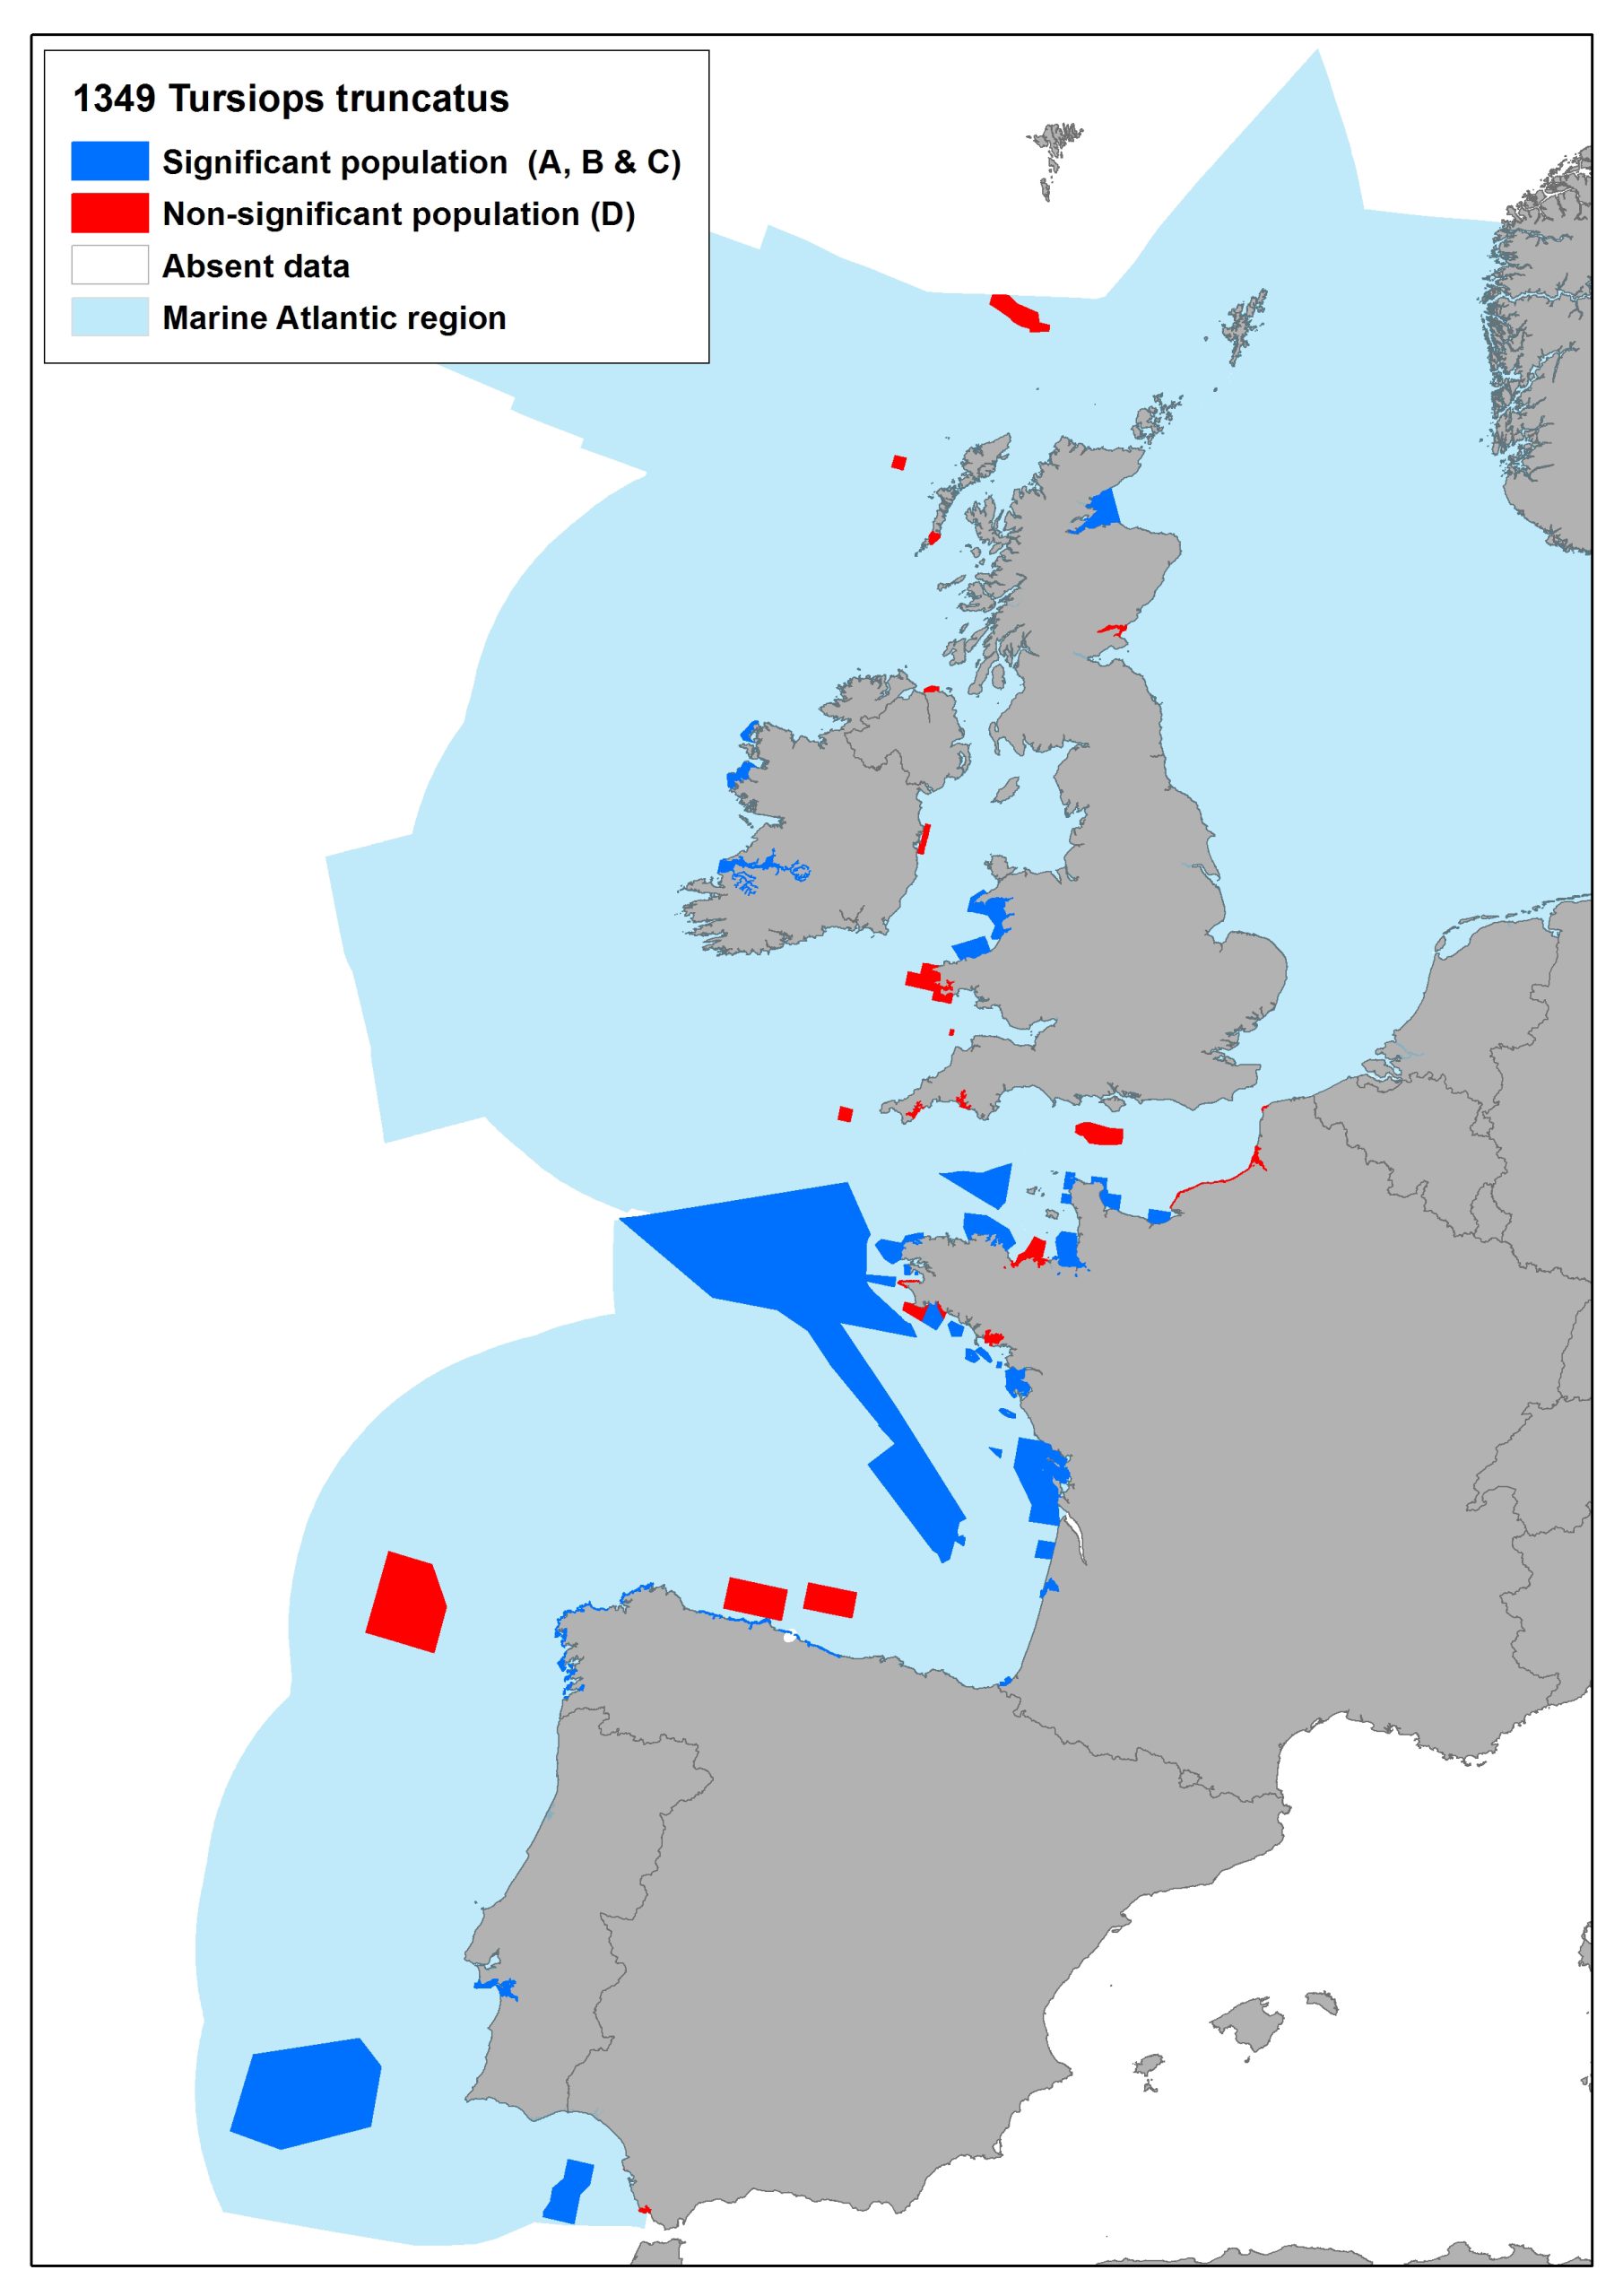
Bottlenose dolphin dedicated Special Areas of Conservation (SACs).